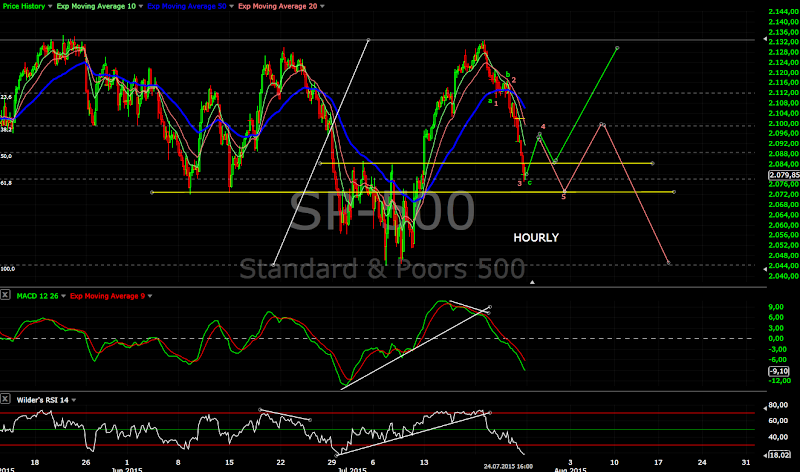
Short term view - bottoming expected and after FOMC we will know only short term bounce and lower or the next leg higher.
Intermediate term view - the final move higher is running...
The mess continues now for 8 months. I do not know for you, but I am getting tired from this..... moved nowhere for so long time. At least it was exciting in PM/Miners sector:)
The level which we see is not a surprise, but I thought we will see it next week and not so fast.
I suspect we will see some up and down moves before FOMC and then we hear something bullish or bearish(has that ever happened?) from FED for the next bigger move.
It does not make sense for me to see a top so early in the cycle and market breadth hitting bottom, but if we see 5 waves lower and break below support levels(see the first chart) than down is down... the charts does not look good and the bulls should step in on Monday.
PM/Miners - well, well who would have thought that we can see an intraday reversal yesterday:) I have promised a reader that I will track PM closely. I think it worked great targets and timing an entry. I hope you stayed calm and used the opportunity yesterday. Now waiting to see confirmation - the charts are below.
TECHNICAL PICTURE
Short term - I thought we will see a bounce from MA50 and than turn lower the whole move taking more time... now with the price moving so fast we can not exclude the option for an impulse. Both scenarios are shown green bullish a-b-c and red bearish an impulse. No signs for a bottom I expect a pause before FOMC... and waiting to see what they will deliver.
Intermediate term - no change, we saw the move lower and waiting for confirmation which scenario will play out. My preferred scenario is the green one.
Long term - significant correction after the move higher is over. Target - MA200/the support zone/the start of the wedge.
MARKET BREADTH INDICATORS
The Market Breadth Indicators - some strange mix at the moment.... some pointing to a bottom from last week, some sell signals again and some oversold.....
McClellan Oscillator - nearing oversold levels.
McClellan Summation Index - sell signal.
Weekly Stochastic of the Summation Index - buy signal.
Bullish Percentage - sell signal.
Percent of Stocks above MA50 - we need higher low for the bullish case.
Fear Indicator VIX - long term is clear higher lows, short term no clue...
Advance-Decline Issues - we need higher low for the bullish case.
NYSE New Highs-New Lows - time for a bounce....
Percent of Stocks above MA200 - ugly for a market so close to ATH. Only 38% of shares are above MA200 - broad based weakness....
HURST CYCLES
Day 14... it will be strange to see a top so early at day 10.
Week 2 of the current 20 and 40 weeks cycle.
Tom Demark SEQUENTIAL AND COUNTDOWN - this technique spots areas of exhaustion.
Currently at day 3...
We need small waves 4 and 5 to confirm an impulse than a corrective pullback as a zig-zag to confirm a bottom. If we see this than we will have a H&S bottoming pattern and the right shoulder is the entry for the rest of your position with a tight and clear defined stop below the last low around 1072.
GDXJ shows the same pattern like gold. Divergences MACD/RSI, waiting for confirmation for an impulse and corrective pullback. MA50 and the last high are resistance where I expect a pullback to begin.
Subscribe to:
Post Comments (Atom)


Molto bueno! Greatly appreciated.
ReplyDeleteHello, could you please update dax chart?
ReplyDeleteSee the new post
Delete