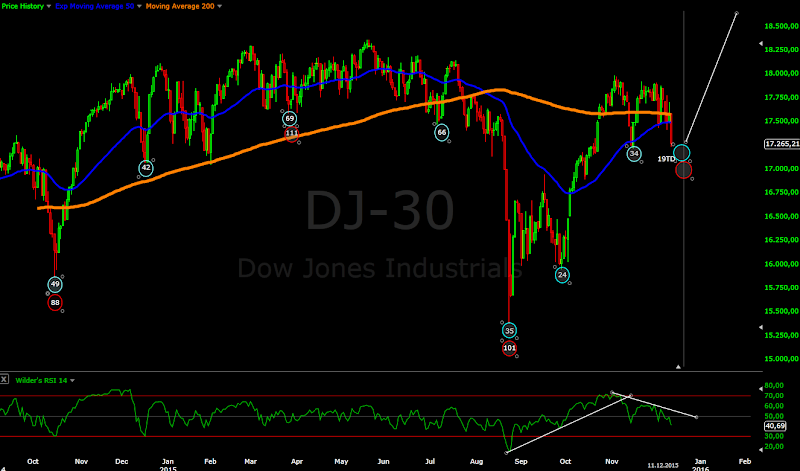
Short term view - deceleration and bottoming for a few days.
Intermediate term view - I think this is a zig-zag correction and 20 week cycle low.
Choppy move lower as expected... until Friday. Now it looks like the alternate pattern simple zig-zag correction from the top early November. Friday feels like capitulation and the pattern looks like expanded ending diagonal... there is a reason to call it ending:)
I see three wave corrective moves.... this is A-B-C for me, 20 week cycle low right on schedule, market breadth and technical indicators pointing to a mature correction the indexes mildly oversold, but no signs for a bottom and reversal so far, pushing prices lower before an important news is usually a sign that the big boys want to buy and want cheaper prices.
All this makes me think that we have a correction and the next move will be higher. Of course we need a confirmation and we need to see some deceleration and bottoming action before FOMC which should give the excuse for a rally for a few weeks.
If I am wrong we will see only a pause for a few days and FED will disappoint causing the indexes to plunge lower... I have problems with such scenario because the suspected wave 3(from the December top) which should the strongest is an overlapping mess and a move lower usually starts when market breadth/technical indicators reset higher and not when they are close to oversold levels.
TECHNICAL PICTURE
Short term - the move this week was five overlapping waves lower which looks to me like expanding ending diagonal and a diagonal appears at the end of a move not at the beginning.
I think it was wave c of C of 4/X. In this case we should see a move higher to MA50/the upper trend line and a higher low to finish a bottoming process before FOMC.
Intermediate term - we have a channel now. If I am right this is only a-b-c and a rally should start from the lower trend line.
Long term - no change
MARKET BREADTH INDICATORS
The Market Breadth Indicators - last week there were no signs that we are close to a bottom and the VIX for example was way to low for a bottom. Now it looks much better the indicators are close to levels which we usually see around intermediate term bottoms... only some kind of bottoming is missing.
McClellan Oscillator - hit oversold level.
McClellan Summation Index - sell signal.
Weekly Stochastic of the Summation Index - sell signal.
Bullish Percentage - in the middle of the range.
Percent of Stocks above MA50 - close to oversold levels.
Fear Indicator VIX - hit 25 which is typical for intermediate term corrections.
Advance-Decline Issues - hit oversold level.
HURST CYCLES
We have now three shorter cycles and we are in the timing band(80 trading days) for a 20 week cycle bottom.
Week 16 right on time for a 20 week cycle low.
Tom Demark SEQUENTIAL AND COUNTDOWN - this technique spots areas of exhaustion.
Buy setup at day 5.
P.S. look at the histogram - I can not see a difference with any other a-b-c move in 2015 two troughs with a reset in the middle close to the zero line.
Subscribe to:
Post Comments (Atom)


Thanks Krasi. Really appreciate your work!
ReplyDeleteThanks! I am glad that the posts are helpful, because they cost time and energy:)
DeleteHi Krasi,
ReplyDeleteHow high do u think it will go? Around 2180?
Thanks!
If it goes higher as a simple impulse the two Fibonacci targets are 2160 and 2190 (5 green second chart).
DeleteThere is an option that we will see a double zigzag for expanded flat (B red second chart) the two Fibonacci targets are around 2190 and 2240.