Intermediate term view - after it is finished(in the next week or two) lower for 6-8 weeks into October.
The market fall a sleep for three weeks... the indexes are around the same levels. It is not a surprise that the rally has stalled (just look at market breadth), but on the other side "nothing happening" is information too and now the pattern looks more bullish. First such sideway move in a tight range is usually a consolidation and wave 4 from an impulse. Not a perfect impulse from the June low wave 3 is shorter than wave 1 (because of that and market breadth I was betting on more bearish pattern), but five waves higher is an impulse... just waiting for higher high from DJ for a confirmation. Second the indexes are spending more time around the highs and cycles look more bullish now. EW - bullish pattern waiting for a week or two to be finished and after an impulse correction follows. Cycles - the price has not changed a lot but hanging around the highs for longer time means bullish cycle. The average length for 40 week cycle is 32-34 weeks with 25 weeks from the February low 3/4 of the 40 week cycle should be behind us. First the signs are for a bullish cycle right translated with 3/4 of the time moving higher, but on the other side we are entering the time window when cycles should start turning lower. Market breadth - the indicators are in bullish mode, but making second top with divergences... indexes should follow soon moving lower and market breadth should reset before the next move higher. Seasonality - not the best for stocks. We are entering a period when stock usually correct lower. All signs are pointing to a bullish pattern, a week or two the current move to be finished, but than lower for a correction. I think we will see wave ii of 3 with target the middle of the range mid-April to mid-June(see the second chart). Of course there is a bearish option, but as long as price stays above the June low the pattern stays bullish.
TECHNICAL PICTURE and ELLIOTT WAVES
Short term - higher for wave 5 from the June low.

Intermediate term - I have drawn deeper retracement because of market breadth and 40 week cycle low expected in October. The price likes to test such congestion zones around this levels are MA200 and 61,8 Fibo retracement. Minimum we should see test of the break out and MA50 around 2110. When the price starts moving lower we will see if it will be deeper retracement or the indexes will just burn time with sideway move.
The June low is the level which makes difference if this is bearish or bullish pattern.

Long term - the bearish pattern(if we see the price below the June low) is shown on this chart - three lower for A, three higher for B and final wave lower C for a flat correction. If you are a bear it looks nice, but you do not want to see this. It will just prolonge the bull market and it will move higher.

MARKET BREADTH INDICATORS
The Market Breadth Indicators - do not look good at all second tops with divergences.... only McClellan Oscillator is pointing higher for the short term waiting to see divergences too.
McClellan Oscillator - one more high for the indicator and divergence expected.
McClellan Summation Index - sell signal.
Weekly Stochastic of the Summation Index - sell signal.
Bullish Percentage - second top with divergence.
Percent of Stocks above MA50 - second top with divergence.
Fear Indicator VIX - very low level and a lot of complacency.
Advance-Decline Issues - lower high and divergence expected.
HURST CYCLES
Day 28 of the 40 day cycle we are nearing the time window for a top of current daily cycle.

Week 6 of the second 20 week cycle. The 40 week cycle looks bullish now with the price moving higher 3/4 of the time.

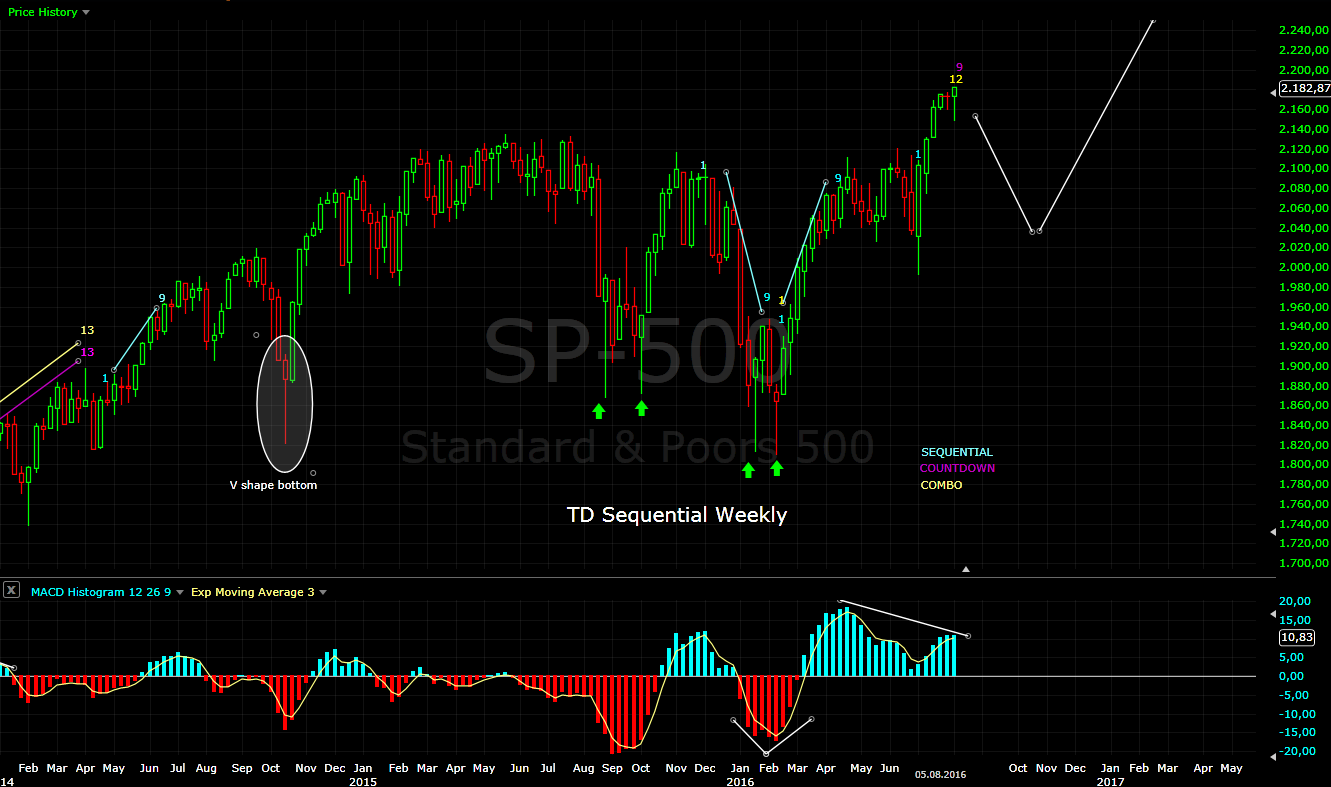
Tom Demark SEQUENTIAL AND COUNTDOWN - this technique spots areas of exhaustion.
One more higher high and we will see a combo finished on the weekly chart. Time for an intermediate term top?
Welcome back! Thanks Krasi. Any view on the Russell 2000?
ReplyDeleteMatt
It looks the same like SP500 to me - impulse from the June low.
DeleteThank you! I'm trying to figure out a good entry point on the short side, but this market is relentless! Please let me know if you find one...
ReplyDeleteBest Regards,
Matt
As you can see patience is important:) Now looks better for a short entry compared to 4 weeks ago... at least there is some pattern to trade now.
DeleteLooking at Russell2000 I think there is one final high for v of 5(currently in iv of 5) to finish an impulse from the June low.
The trigger is when you see a higher high with RSI divergence on the hourly chart.
CAREFUL this will be again an entry without confirmation. There will be another opportunities for an entry too. I do not expect sharp reversal, I think this will come later with the second part of the correction. The price is well above MA50 on the daily chart and a big sell off occurs after the price moves below it. The first move will be to test MA50.
Usually the right decision is to split the position into several trades when you suspect reversal, but there is no confirmation to avoid big loss.
Interesting and VERY valuable advice, I always wondered what you meant by wait for a lower high (how do you know it's not going to make a higher high?) or higher high with divergence. Now I get it...makes sense, watch for the RSI divergence. Patience is the toughest part of this game, but you are right it pays off :) Thank you for all the advice Krasi, much appreciated! By confirmation do you mean trend line break or MA50 break/retest and failure to break above? After Brexit/Rebound, I just don't know what confirmation means :)
DeleteConfirmation is something which tells you with very high probability we have reversal.
DeleteIt could be an impulse in the opposite direction or a move below the last minor low or something else.
In the current situation the move higher stalled again for three days and the daily charts look bad with divergences MACD/Histogram/RSI... but no confirmation. No big red day, the move lower is still only three waves. The first sign will be if we see a lower low today this will finish 5 waves from the top than we need lower high and 100% confirmation is move below the last minor low(early August). If we see a move higher today than we have only corrective move lower and no confirmation - probably wave ii of 5 and iii higher will follow.
All this is digging deeper in short term charts. The price is well above MA50 and the 40 day cycle is at day 31 bullish right translated. So the first leg lower should be shorter in time and deep retracement is expected. Do not hold you breath to time the top there will be enough opportunities... patience.
The money are made when you follow the trend and not when you nail the top... sounds simple, but I have still problems with patience too:)))
About reversals - usually this sequence of events(impulse in the opposite direction/lower high/break below the last low) repeats by every reversal. A trend is higher highs and higher lows and if you see lower high and lower low what tells you this? - the trend has reversed.
There is three entry points:
1. the top - you need at least something to justify an entry... finished pattern/impulse, divergences, support/resistance hit etc.
2. lower high - corrective move and failed attempt to make higher high
3. break below the last low
Different traders trade differently - "brave" traders will try to time the top 1, "smart" traders will split the position with entry points 1+2+3 or 2+3 or 1+2 and those who do not like the risk will choose point 3.
The theory is again very simple and applying it in practice very difficult:)
Krasi, Thank you so much for taking the time to explain this to me. This is a great explanation, and I'm very grateful :) This is all very logical and I only wish I'd asked you earlier!
DeleteThank you
welcome back Krasi...!
ReplyDeleteThanks for the update! For the RUT, any target for higher high for the v of 5?
Jules
The daily chart does not look good anymore the indicators with divergences and three days sideway move... I think something lower is running already.
DeleteThanks Krasi. Appreciate your insight.
ReplyDelete- Kali