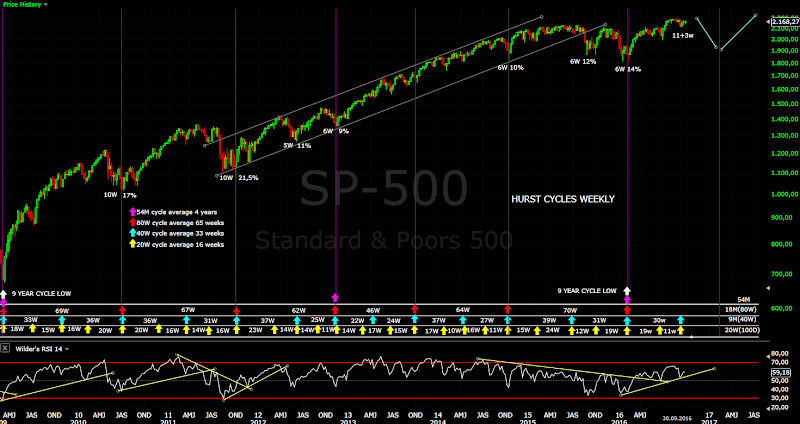
Short term view - one more wave lower to around 2135-2140 and than the ATH should be tested.
Intermediate term view - a few more weeks higher after that the 40 week and 18 month cycles should turn lower.
What we knew last week - we have corrective waves and not to expect a rally higher... the pattern not clear. We saw very choppy week with sharp moves higher and lower confirming that we have corrective structure.... the pattern still ambiguous.
In the last post I have shown one bullish pattern ED and one bearish zig-zag... despite other possible patterns I still think this two make most sense.
The news about DB altered the short term waves, but not the pattern. The difference is now SP500 looks better with ED and the DAX with 7 waves lower we have possible finished double zig-zag followed by strong impulsive rally.
On the other side DJ will look better with lower low and if you look at the RSI trend line and MA50 on the daily chart you will see that the down trend is still in tact, the indexes are struggling to close above MA50 without success which is bearish.
Tough choice:) I favor the ED at the moment.... in fact we do not need to choose. Analyzing and trading are two different animals. Looking through the eyes of a trader - if we see five waves lower to around 2135 for c=a of 2 of ED and reversal you enter long position and you know where the stop is. If it is the bearish scenario the price should move through this level without hesitation and stop 5-10 points below the last low 2119.
TECHNICAL PICTURE and ELLIOTT WAVES
Short term - despite the impressive rally it still looks like corrective wave b(or ii for the bearish scenario). Next target is c=a around 2135-2140 to finish wave 2 of an ED.
If we see the price moving through this area than we are watching the bearish scenario with target around 2110.
Intermediate term - the down trend is still in tact. The price is struggling with MA50 and RSI do not have enough inertia to break above the trend line. Waiting to see which pattern will play out. ED has slightly higher chances, but we will see.
Long term - no change. I think this is wave 1 of the final move higher for this bull market.
MARKET BREADTH INDICATORS
The Market Breadth Indicators - look like want to move higher for one more divergence before a bigger move lower, no strong sell or buy signal.
McClellan Oscillator - oscillate around the zero line.
McClellan Summation Index - probably it will move higher for a divergence.
Weekly Stochastic of the Summation Index - turned up from oversold level buy signal.
Bullish Percentage - still above 70 no signs of sell signal.
Percent of Stocks above MA50 - in middle of the range.
Fear Indicator VIX - complacency we should see divergences in the next weeks.
Advance-Decline Issues - heading higher expect divergence.
HURST CYCLES
We are in the time window for 40 week cycle low just waiting to pinpoint the low at week 11 or week 15-16. With three green weeks in a row the probability is higher that it is behind us (ED is running).
Tom Demark SEQUENTIAL AND COUNTDOWN - this technique spots areas of exhaustion.
Waiting for a close above bar 8 of the countdown than we will have finished countdown on the weekly chart.
The two options for RUT with TNA as a proxy.
DAX - we saw one more lower low and now the short term and long term pattern synchronizes perfect with the US indexes.
Subscribe to:
Post Comments (Atom)


Thank you for the update Krasi! If TNA/RUT started going higher on Monday and broke the RSI trendline, I was wondering what you think the third option would look like? I'm just trying to figure out what a good stop price would be for a short position.
ReplyDeleteThank you again for all your advice, we're very grateful!
Matt
Clear stop level is the last high 1263 for RUT (2180 SPX) than my analysis is wrong.
DeleteIf we see continuation higher... now idea what the pattern will be.
Thank you that makes sense. Hopefully one of your two options is running.
Deletehi Matt, i mostly trade the RUT too so its great to have some levels....it will be nice to exchange ideas during the week. what's your mail? mine is raymondjonesmails@gmail.com
DeleteKrasi, looks like you are opting for an ED for RUT as well. what made you switch? The bounce from Sept 12 lows could well be an impulse? if thats the case, then we would have a normal impulse wave to the upside...thoughts?
ReplyDeleteDAX probably made its low already and three green weeks in row unusual just before 40 week cycle low - this points to a low already behind us which makes me favor the ED. RUT should follow. It is more likely that the bounce from Sept. 12 is three waves. ED is impulse with corrective waves.
DeleteHello Krasi, Thank you for information here. I did not get this line:"Intermediate term view - a few more weeks higher followed by 40 week/18 month cycle high." doe sit measn we are going higher few weeks and then 1.5 Year afterward we going higher? Thank you.
ReplyDeleteHello,
Deleteyou are right not very clear, I have changed it.
I mean after a few weeks higher the 40 week and 18 month cycle should make their high and
turn lower.
Thank you :)
ReplyDeleteKrasi your analysis couldn't have gone any better, how much lower do you feel SPX will go? When will we be met with a bullish pullback?
ReplyDeleteIf the pattern continue to work something like 2135 than we should see reversal higher.
Delete