Intermediate term view - after the final move higher correction for a few weeks.
Boring week with sideway price action. We saw a small move lower and the final move higher should be around the corner. Overall for a month since mid-December the price moves in a tight range and time is running out.... volatility should rise soon and either we will see final spike higher or the price will reverse lower. A month ago I have shown different US indexes... they are moving as expected, which does not really help us:). Nasdaq looks like finished impulse from the November low, SP500/NYSE mixed could be counted as finished or could extend a little bit higher, DJI,DJT,RUT,XLF - I do not see a way to count this as a reversal it should be wave 4 with one final spike higher before a bigger pullback. As I wrote last week I favor the scenario with the indexes moving higher before a reversal.... next week we should have our answer. TECHNICAL PICTURE and ELLIOTT WAVES
Short term - move higher(green) expected, but watch the support line. The price has nothing to do below support,the gap and MA200. Below this level something bearish(red) has started.
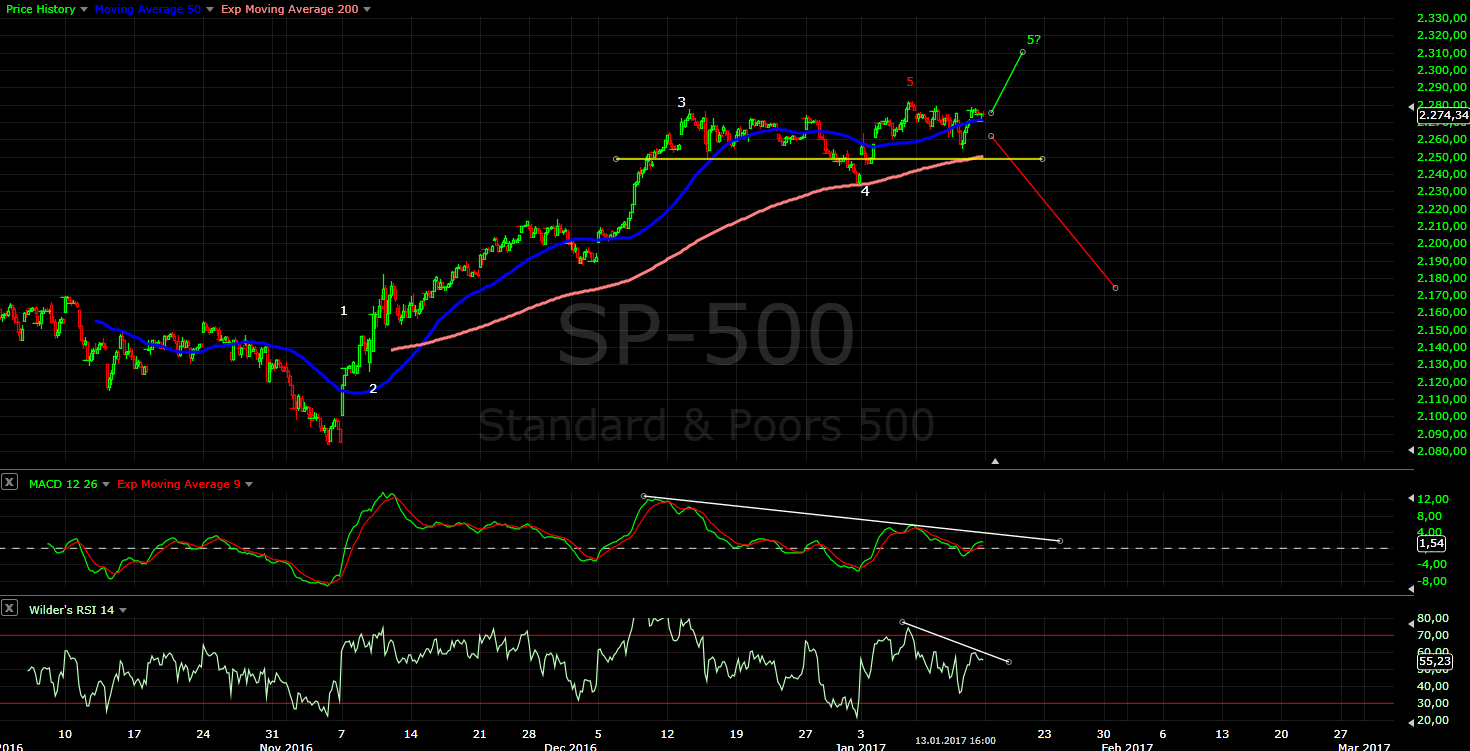
Intermediate term - no change waiting to see how a correction will look like. RSI either it rises from the trend line for a top with a divergence or accelerates and breaks below the trend line. The same for MACD - either it rises for a top with a divergence or it accelerates lower.

Long term - no change, waiting for the wave from Feb.2016 to be finished.

MARKET BREADTH INDICATORS
The Market Breadth Indicators - the same like last week. Short term no reversal signs, but double divergences on some indicators suggesting that something bearish is around the corner.
McClellan Oscillator - making lower highs.
McClellan Summation Index - buy signal.
Weekly Stochastic of the Summation Index - buy signal, in overbought territory for a while.
Bullish Percentage - buy signal, but double divergence.
Percent of Stocks above MA50 - second high still buy signal above 75, but double divergence.
Fear Indicator VIX - very tight BB again and complacency.... volatility will rise soon.
Advance-Decline Issues - one more push to overbought levels will look better.
HURST CYCLES
Day 9 of the second 40 day cycle.

Week 10 of the 20 week cycle... indexes should be nearing a top.

Tom Demark SEQUENTIAL AND COUNTDOWN - this technique spots areas of exhaustion.
9-13-9 finished last week, but no price flip so far.... no sell signal.

Hello Krasi
ReplyDeletethx for the update! such a difficult week...so many people expecting a pullback around the elections, it is difficult to see it play out that way... a contrarian view would say that a correction would be shallow not to allow people to buy the dip, or that market keeps going up in a low vol fashion...
Do you have an idea of the level this last surge could reach, or is it too unreliable?
thx again, and good luck!
I have not made any estimation because this final leg should not last very long and move much higher. I will just watch the wave developing.
DeleteIt looks weird today because both Gold/PM up a lot, hanging man (trend reversal) or just low volume test (which means trend continue...). At the same time, Stock appears to be exact the same situation: very long upper shallow, which means bullish or bearish? And the volume is also quite low.... Very scary test...
ReplyDeleteHopefully you can comment on these situation. Thanks.
And the support MA20 2264.3 seems to be broken or not? Thanks.
DeleteAs I wrote in "Long term update" expect in Q1 counter trend moves - stocks/USD lower and gold/bonds higher. It is playing out. The move up for gold/bonds looks bullish an impulse so there should be more to the upside after a pullback.
DeleteThe stock indexes - if the bullish scenario plays out, we should see a sideway move February and March for 18 month cycle low.
Short term - we should see pullback lower for gold/bonds and for the indexes final spike higher before bigger correction.
Thank you! I think this should be the trend of several weeks: "expect in Q1 counter trend moves - stocks/USD lower and gold/bonds higher. It is playing out. The move up for gold/bonds looks bullish an impulse so there should be more to the upside after a pullback." And "Short term - we should see pullback lower for gold/bonds and for the indexes final spike higher before bigger correction." is for the next few days. Right? While stock indexes hits 18 month cycle low in March, I recall you said gold/gold miners also will hit 18 month cycle low?
DeleteMy analysis is based more on price patterns and less on time. I can not give exact time frame, but "short term" mentioned above should be something between 1 and 2 weeks.
DeletePM/gold miners - pattern said we have finished zig-zag lower and now we see a move higher as expected. Time says the important low should come later. I do not know how this will play out... at the moment I suspect one more higher high for the USD/yields which will cause a low for PM/gold miners. Probably higher low because the pattern will fit better (alternate some complex corrective pattern - double zig-zag/triangle/flat).
I do not know... so what do you do in this case - we are trading price not time, price pattern trumps time, trading trumps analysis.
I bought some gold miners. This move higher looks like an impulse and if you see corrective move lower you can add more. Later the analysis will be adjusted.
hello Krasi is this the pullback you were looking for in gold today or is there more to come in the next few days? do you think it will go below 1200?
ReplyDeleteThe pullback should last more than a day... we should see something like 38% retracement at least.
DeleteKrasi, I wish I had your level of knowledge, most professionals on Wall Street believe it's ridiculous to try to predict the direction of indexes, yet you do it with great confidence and accuracy. I've been following you for a year now, and am very impressed. However, I never know how you intend to trade this analysis (i.e., what part of the analysis do you have most confidence in)?. Your red line this past week was most helpful, but not sure if you're saying short SPX if it goes below that line? or look for a shorting opportunity if it breaks? I know you want to trade less, longer cycles, but if you think SPX is too early for end of bull market, and going to 2400-2600...are you looking for a good entry for a short position or long position?
ReplyDeleteThe professionals:) 10 years later I can only laugh when I listen to them.
ReplyDeleteYou can not predict perfectly how the indexes will move, but make a good estimation so that you can extract profits.
Yes, analysis and trading plan are two completely different things. You have to trade the analysis so that you can extract as much as possible profit, but in the same time if you a wrong to be hurt as least as possible.
And sometimes you do not know the exact pattern, but you know that price will move higher or lower. 2016 was a perfect example - still no clue what pattern we have, but bullish in Feb.2016,Jun.2016 and Nov.2016
The current situation - the move since mid December has too much similarities with corrective wave 4. The indicators are resetting, but price is just killing time.
The probability is higher to see a move higher. So I wait for higher high to short.
If I am wrong we should see a sudden plunge lower(impulse) below support followed by corrective retracement higher. At this point I will short when I am proven wrong and price action confirmed reversal.
This weekend I will show one new pattern and I plan to short the indexes(when the time has come) because there is a probability that the move lower to be much bigger than expected, but still the bull market should not be over.
Thank you Krasi. I compile and reread these great insights you give me/us so I have rule sets for trading :) trafdingwise if you see impulse lower do you short when you recognize the impulse or wait for corrective retracement higher? P.s. When i said professionals i meant hedge funds and portfolio managers who focus on stock picking... do you think TA is easier for individual stocks or indexes?
ReplyDeleteIt is easier to trade indexes. TA works with single shares, but there is surprises and there is huge gaps you can not react. Single shares are much more volatile. The bigger problem is you have to check hundreds of charts... you can not know which is the next rocket. It is a better choice to follow 2-3 markets, but to know them very well.
DeleteIf you want to double/triple your money you have to search single shares.. rockets:)
If you want to make consistently profits every year choose 2-3 indexes. With the time the profits will grow, no need to chase rockets.
Depends on the time frame - if the impulse is on the weekly chart no need to wait, if it is on the hourly chart wait for a short retracement for an entry.
This with the entry point is more complex... this is one of my comments:
Confirmation is something which tells you with very high probability we have reversal.
It could be an impulse in the opposite direction or a move below the last minor low or something else.
About reversals - usually this sequence of events repeats by every reversal - impulse in the opposite direction -> lower high -> break below the last low. A trend is higher highs and higher lows and if you see lower high and lower low what tells you this? - the trend has reversed.
There is three entry points:
1. the top - you need at least something to justify an entry... finished pattern/impulse, divergences, support/resistance hit etc.
2. lower high - corrective move and failed attempt to make higher high
3. break below the last low
Different traders trade differently - "brave" traders will try to time the top 1, "smart" traders will split the position with entry points 1+2+3 or 2+3 or 1+2 and those who do not like the risk will choose point 3.