Feb 28, 2017
Update
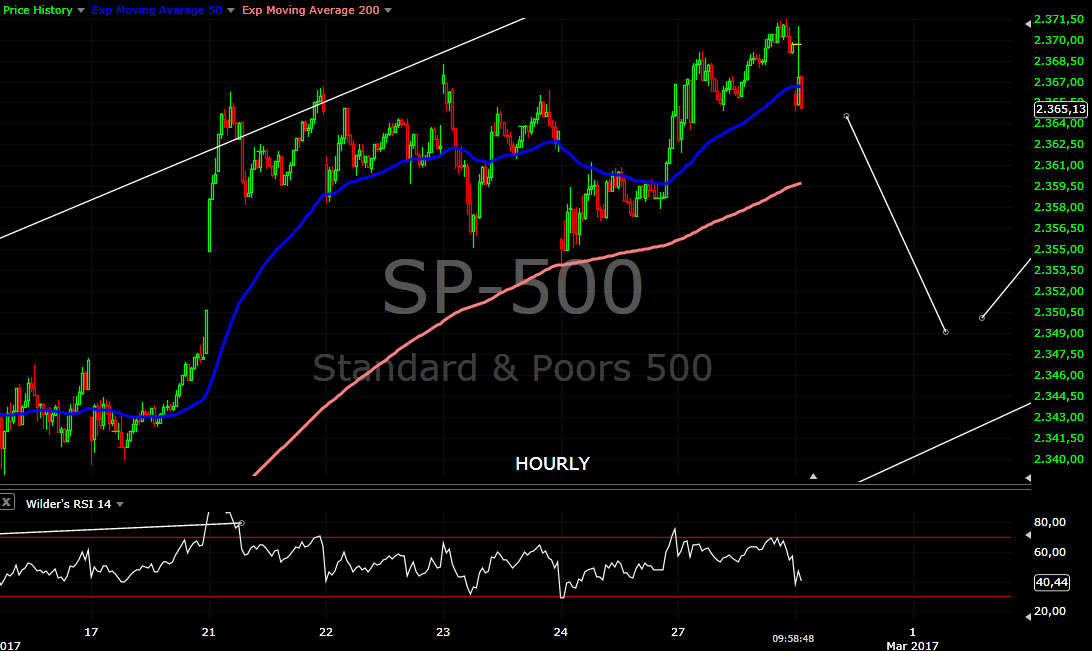
UPDATE - Yesterday I pointed out that we have impulse higher and this is not wave iv anymore. It looks like this impulse was just wave (i) of v and today we are seeing wave (iii) of v
Careful if you have longs. We have 5 waves higher so this could be the top. Now we have enough waves to count finished pattern from the January low.
This is 10 min chart it looks like impulse higher probably this is not part of wave iv.

Subscribe to:
Post Comments (Atom)
Thx a lot for your update Krasi! Much appreciated... let's see what happens!!!
ReplyDeleteWhen stock begins the correction, how does gold/gold miner react? To me it looks like up initially and down together with stock later. Because initially people use it for risk hedging, but later, everything down together. Is it reasonable? Thanks. It seems gold miner is mixed with PM and stock... How to deal with the multiple relations?
ReplyDeleteI would not follow relations on such scale - a few weeks. I would follow just the price action and the charts this is what matter. For example gold and stocks moved higher together this year so far and I would not trade miners/gold on what I expect for stocks.
DeleteThe relation flight to safety bonds/PM<->stocks works on bigger scale. When I look at the current EW and cycle counts I see similar picture like 2007-2009.
Stocks should have one more leg higher in summer, PM/miners should move sideward or finish a move lower. After that stocks should weaken and PM/miners rally higher. In 2018 stocks should turn lower and PM/miners should continue moving higher - all fleeing to safety PM/bonds. In the second half of 2018 PM should turn lower after an 8 year cycle high and probably plunging lower together with stocks in 2019(4 year cycle low for stocks).
All this is based on my current cycle analysis, but if you open a chart 2007-2009 you will see exactly the same behavior/relation.
Thank you, very nice explanation. Now I'm wondering how gold/gold miners go after trump speech. The stock market may start correction. It seems gold should at least rebound/retest after yesterday's impulsive selloff
DeleteYes should bounce soon, gold should follow miners lower in March.
DeleteSo "gold should bounce soon" means while the whole market begins correction, gold/gold miner first rebound and then crash again together the stock market for another leg in March?
DeleteI mean gold miners should make one more lower low and bounce higher, and after that gold and miners should move lower in March.
DeleteThe current gold hour chart looks like some head shoulder top. In this sense, gold may continue to crash... How to determine whether it's real or?
DeleteWhen you see impulse(5 waves) there will be more in the same direction.
DeleteWhen you see the head forming with impulse and the shoulder as corrective move, the probability is very high that this H&S will play out.
Interesting, so impulse 5 waves header shoulder shape is continuation pattern while head impulse and shoulder corrective move is reversal pattern. Sorry to bother, is it possible to show example of impulse 5 waves header shoulder shape as continuation? Thanks.
DeleteI do not have an example at hand. It is simple EW:
Delete- when the right part of the head is impulse(5 waves) with very high probability the right shoulder will be just a correction and the H&S will play out.
- when the right part of the head is zig-zag(3 waves) this is just a correction to support level and with high probability the H&S will not play out.
same for RUT?
ReplyDeleteRUT looks better like wave iv, but no problem to count it as finished pattern too.
DeleteThis is typical around tops/bottoms when the pattern is mature - it is very difficult top nail it.
thank you Krasi! i agree had to nail top, and no one should try....lets see how things play out. I will see if we get a bounce and load on some shorts
ReplyDeleteHi Krasi, Thanks for the updates. What does today's update imply in terms of targets for the S&P for waves (iii) and (v) of v in your opinion? Thank you
ReplyDeleteThe measurements for wave v are roughly 45 and 70 points - add this to 2352
DeleteThank you, what about RUT? Which seems to be more range bound these days..is wave v much smaller you think?
ReplyDeleteI do not have intraday RUT charts......
DeleteNo worries...thank you for the updates and great work! As you've said countless times impossible to time tops so always best to wait for a confirmation reversal...
ReplyDeleteSeems the more Trump delays his tax plan the longer this can continue higher...no reason to selloff until then.
DeleteThis move is not unusual. We needed fifth wave higher and at tops/bottoms you see such final flush. The top should be around the corner. I am out of bullish counts:)
DeleteNo need to hurry. The price is well above the MAs and such moves seldom just reverse and plunge.
Assuming the top is in, what is your prediction for the duration of the reversal? Pattern suggested a March 20 bottom but that's too soon isn't it?
DeleteThanks,
Kali
This should be just for wave A. Currently we have 20 days expect another 15 days for the 40 day cycle low. After that we need one more 40 day cycle for 20 week/40 week/18 month cycle low. I am expecting 6-8 weeks lower or the second half of April...
DeleteSo bottom of A should be at 18 month cycle low in second half of April. Got it.
DeleteThanks
I mean March 20 should be just wave A(another 15 trading days for 40 day cycle low) and the correction should be over after one more 40 day cycle with an 18 month cycle low in late April.
DeleteSo waiting for wave 4 ..small pullback then final wave 5?
ReplyDeleteIt is more likely that this is wave 5. See XLF much more clear count. Now waiting for confirmation with impulse in the opposite direction.
DeleteHi Krasi, TA question for you, so I look at XLF and see RSI divergence on daily in December vs November high but then Feb22nd/23rd highs vs today I see positive divergence on RSI and MACD...only negative divergence on MACD histogram. Should that imply we need to wait for higher high with divergences on all 3 on daily or should I be focusing on hourly charts at this pt in EW cycle?
ReplyDeleteYou look for divergences between the tops/bottoms of two distinct moves/waves. On the Daily chart this is the December top and now. The Feb.22 top is from minor degree.
DeleteIf you want to compare the Feb.22 top with something you have to move to shorter time frames and look inside the move from the Jan low until now to compare waves of the same degree.
Hourly chart will do the job.
So does PM has finished rebound or not yet? To me it has not yet...
ReplyDeleteI wrote several times that I expect lower prices in March. Miners are lower USDJPY higher... I do not think that PM will decouple.
DeleteI thought you mentioned rebounded soon yesterday... so the rebound is so weak...
DeleteI mentioned rebound for the miners after the big bar from Monday, but I was talking only short term. They are moving impulsively lower and I was expecting wave 4(we saw it yesterday) and they continue lower today.
DeleteObviously you meant short term rebound before continuing lower and I was talking about intermediate term.
Now I see.. so today is like fifth wave lower... should we expect higher degree rebound today? Thanks.
DeleteYesterday the rebound looks like head/shoulder bottom. but it seems too weak... It's continuation rather than reversal... Is there better way to find out the head/shoulder, if we can take yesterday's example?
Not today, silver looks like wave 3 so one more lower low before something bigger to the upside. Probably the miners will follow too with bigger rebound.
DeleteI suppose you mean he miners - there were no break out. Instead a gap higher we saw a gap lower. The only way I know to follow price is to look at the EW pattern. I knew we need one more lower low and I even did not notice H&S just a flat correction 3-3-5 for wave 4.
I agree. Now it seems gold has already five waves... I don't know should exit long gold miner now or wait for rebound.
DeleteI would say we should see a better price next week...
DeleteI was holding EXK and I was forced to exit:) obviously bad data reported today.
by better price I assume you mean higher? :) I'm holding gold miner and hope to exit after rebound...It seems short gold miner now is too late and too risky?
DeleteYes, higher prices. It is too late for a short, wait for a corrective move higher.
DeleteIt looks like RSI divergence is usually earlier than MACD divergence? Today gold is testing daily EMA50. You said it shouldn't be broken easily...
ReplyDeleteThe daily EMA50 is at 1220. There is still room before reaching it.
DeleteYeah... and does MACD break zero lines not easily either like EMA50 as resistance/support? Thanks.
DeleteI do not think the zero line is some special support. In the books you will see zero cross as a signal, but it generates too many false signals.
DeleteWhen you have a correction often MACD moves to the zero line and turns again in the direction of the trend - sometimes at the zero line sometimes slightly above or below it... too imprecise for me to use it as a trading signal.
Krasi
ReplyDeleteDoes this appear to be the impulse in the opposite direction that you are looking to for confirmation of the move lower?
Thanks
Yes, it looks like reversal to me. Instead of continuation we are seeing reversal. Confirms that Wednesday was an exhaustion and not a break out higher.
Deletekrasi
ReplyDeleteI have been following and implementing your analysis into my own trading for a while now. I appreciate your work.
Thank you
Glad to hear that the analysis are helpful:)
Deleteguys...looks like the decline started! I able to load up on RUT bearish positions with the bounce of yesterday....thx Krasi! U r the man
ReplyDeletelets see how Wed. plays out...dont want to get way excited before making the $$$
Delete:-)
Looks promising, but one red day is nothing no 100% confirmation. If we are lucky this will be one of the rare occasions when we nailed the top:)
DeleteThis is the right behavior open some shorts, but not getting too exited.
Any expectation for the PM rebound in larger degree? Thanks.
ReplyDelete1 hour chart shows gold miner hit EMA50 resistance... and dollar index shows five wave impulse correction,
DeleteThis five wave impulse correction for the USD is part of a bigger correction - C of a flat. It is more likely that the USD continues higher.
DeleteFor me larger degree is a few weeks and PM should move lower for a few weeks.
There will be bounces as yesterday - on the daily chart gold bounced from support and EMA50.
The gold almost hit EMA50 with DOJI, is it valid support or still needs some solid touch to EMA50? Thanks.
ReplyDeleteIt is valid. The price moves away from MA50, then back to MA50 and bounces of it. We have all of this, but no information for the future. MA can not give you information if after a bounce the price will continue higher or oversold bounce and continuation lower.
Delete