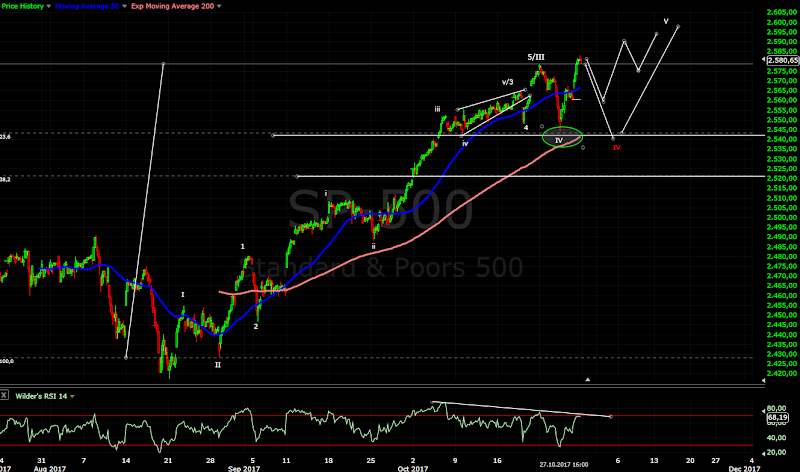
Short term view - higher for the final wave 5 from the August low.
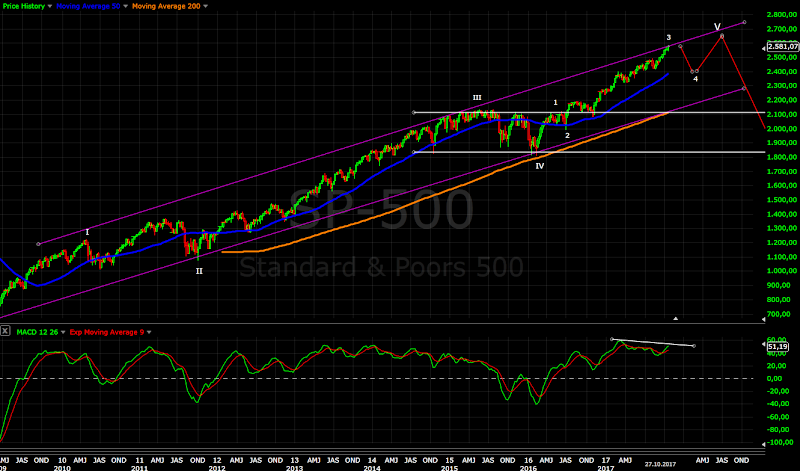
Intermediate term view - heading higher for the top of wave 3 from the Feb.2016 low.
SP500 squeezed a few points and we saw pullback 30 points. Every index looks a little bit different short term, but the common is one more high or to finish the final wave so I still expect one more high before an important top.
TECHNICAL PICTURE and ELLIOTT WAVES
Short term - the first target for a pullback was hit(the green circle from last week). The move lower has only three legs which is corrective. On the upside despite the strength the move so far is only a-b-c too(better visible on the NYSE and DJ probably not so much tech stocks in the index). In this case there is two options - one more leg lower for a flat correction(the red IV) or a ED for wave V.
Of course there si a bullish option acceleration higher for an impulse, but looking at the indicators and other indexes it does not look likely.
Intermediate term - now waiting for one more higher high for nice finished pattern with RSI/MACD divergence. This should be the top of wave 3 from the Feb.2016 low.
Long term - no change, waiting for the top of the current leg higher then one more correction and a rally before the end of the bull market.
MARKET BREADTH INDICATORS
Market Breadth Indicators - all indicators turned lower. I expect to see divergences when the final wave up is running.
McClellan Oscillator - below zero, one final move above zero for a divergence will look great.
McClellan Summation Index - sell signal, expecting a divergence after the final wave up.
Weekly Stochastic of the Summation Index - sell signal.
Bullish Percentage - sell signal.
Percent of Stocks above MA50 - turned lower and below 75.
Fear Indicator VIX - I expect higher low and explosion higher.
Advance-Decline Issues - lower since September and now plunging below 0.... strange for "strong" indexes making all time highs.
HURST CYCLES
The low for the 40 day cycle was hit at day 47, alternate one more leg lower for 2-3 days.
Week 10 of the 20 week cycle.
Tom Demark SEQUENTIAL AND COUNTDOWN - this technique spots areas of exhaustion.
Now we have finished sell setup on the weekly chart. For a sell signal we need a price flip.
Subscribe to:
Post Comments (Atom)


Any chance you could show us a picture of qqq?
ReplyDeleteThanks again,
Kali
It is the same like last week - in iii of 5 on the chart which I have shown.
DeleteQQQ looks toppy 5 waves on the hourly chart with RSI divergence.
Deletehttps://charts.stocktwits.com/production/original_99628869.png?1509466491
thanks krasi
Deletekali
Haha. I buy more. Haha. U say pullback. I say buy buy. Hahaha
ReplyDeleteHi Krasi
ReplyDeleteWouldn’t you agree that the pullback in wave IV should be deeper? The market is so stretched that 10% should come very easily and given that there is so much room for this wave. I think even a drop to 2100 would not violate EW theory. If you disagree please explain why. Thanks
Kris
Sharp correction in a bull market will fit better - 8%-10% is standard correction I expect something like this. Drop to 2100 is 20% and I do not see conditions for such move. You do not have market breadth divergences for example A/D issues or VIX so even if this is the top of the bull market since 2009 the top will be tested and we will see double top before 20% sell off. The greed can be purged when the move is sharp no need to be 20%.
DeleteI draw this wave 4 stretch in time to fit my cycle count currently we have 18 month cycle top, 18 month cycle low in June and 4 year cycle high the end of 2018.
Am I correct in seeing full wave count on Nasdaq composite?
DeleteIf you mean from the Feb.2016 low... some count it this way as completed. I would rather count it as the top of wave 3. This is the problem with EW:) sometimes is not 100% clear.
DeleteInteresting to see how the Dow Transports and the McClellan Summation Index are not showing strength right now. Maybe the major indexes will catch up with these two and correct. That would suggest that a trading bottom may be about 10 days away.
ReplyDeleteBy the way, I really appreciate these charts and the projections even though they do tend to sway a bias in me. this is really a unique market that we have going on now.
the next major buying opportunity seems like a long time away. I haven't the stomach to stay short very long....it frankly drives me crazy to be short.
The next buying opportunity is the low of wave 4.... timewise the next important low should be in 4-8 weeks the low of the 40 week cycle.
DeleteWhat if you buy ETF which is short something:) is this long or short? You should trade only when you feel comfortable with the trade no need to chase every move.
Massive capitulation by the shorts, hardly anyone dares to short now. Could we be near a short-term top for the next few months?
ReplyDeleteYes, the indexes are close to important top - wave 3 from Feb.2016 low.
DeleteHahaha. Who listens make money. I say up. It’s up. Everyday I right! Hahaha. No pullback! Go up and up when Krasi say pullback! Hahaha!!
ReplyDeleteI up again today! So tired my money bag so heavy. Help me lift my money bag!! Hahaha.
Still looking for one more high Krasi ?
ReplyDeleteDifficult question - you can count finished pattern for SP500, but for other indexes one more high will look better. Probably it will take time to see a reversal the top will be tested and the indexes will not make a top at the same time.
DeleteHow about XBI and IBB? It seems XBI is stronger?
ReplyDeleteBiotech looks like impulse lower and correction higher.
DeleteHi Krasi,
ReplyDeleteThis recent move by Nasdaq seems incredibly strong for an ending move. No?
Thanks,
Kali
There is one more hurray:) I think this is the top of wave 3 from the July bottom.
DeleteThis is SOX but the same idea... I have the suspicion the indexes in iii of 5 from the FEB.2016 low.
https://charts.stocktwits.com/production/original_100172907.png?1509774288