Intermediate term view - the move lower should last for a few weeks. The pattern develops so far like wave IV from the Feb.2016 low.
The indexes turned lower with scary sell off on Friday... such development is not a big surprise. As I wrote two weeks ago what goes vertically higher comes the same way lower. Just look what happened the next month after the exhaustion monthly bar in March 2000 - all gains were retraced. If my count is right all the January gains will be wiped out in February. Nothing new under the sun:) the same old story greed and fear.
It is just one week, but time and pattern are pointing at wave IV from Feb.2016 at the moment. The current pattern lower develops as an impulse(more to the downside), 20 week cycle low is expected late February/early March(a few more weeks lower), market breadth turned lower, but not even close to oversold (a few weeks before we see an intermediate term low). TECHNICAL PICTURE and ELLIOTT WAVES
Short term - gap below the first support level and sell off to the second support level/the trend line/MA200. We still need to see wave 4 and 5 for confirmation, but no signs of a bottom - price and indicators are just moving lower. So with high probability we will see the missing waves next week.

Intermediate term - currently it develops like impulse lower to MA50. This means bounce higher from MA50 for wave B and one more leg lower for a finished zig-zag wave IV around 0,236 Fibo retracement and the tend line just on time for a 20 week cycle low. RSI is breaking a lot of trend lines which means this is not some lower degree wave the only one which fits is wave IV.
P.S. The Fibo measurements for the impulse from Feb.2016 are way too perfect... scary:) when it looks perfect something goes wrong.

Long term - it looks the expected correction is running. RSI is about to test the trend line and this should be a wave of higher degree and this is wave 4.
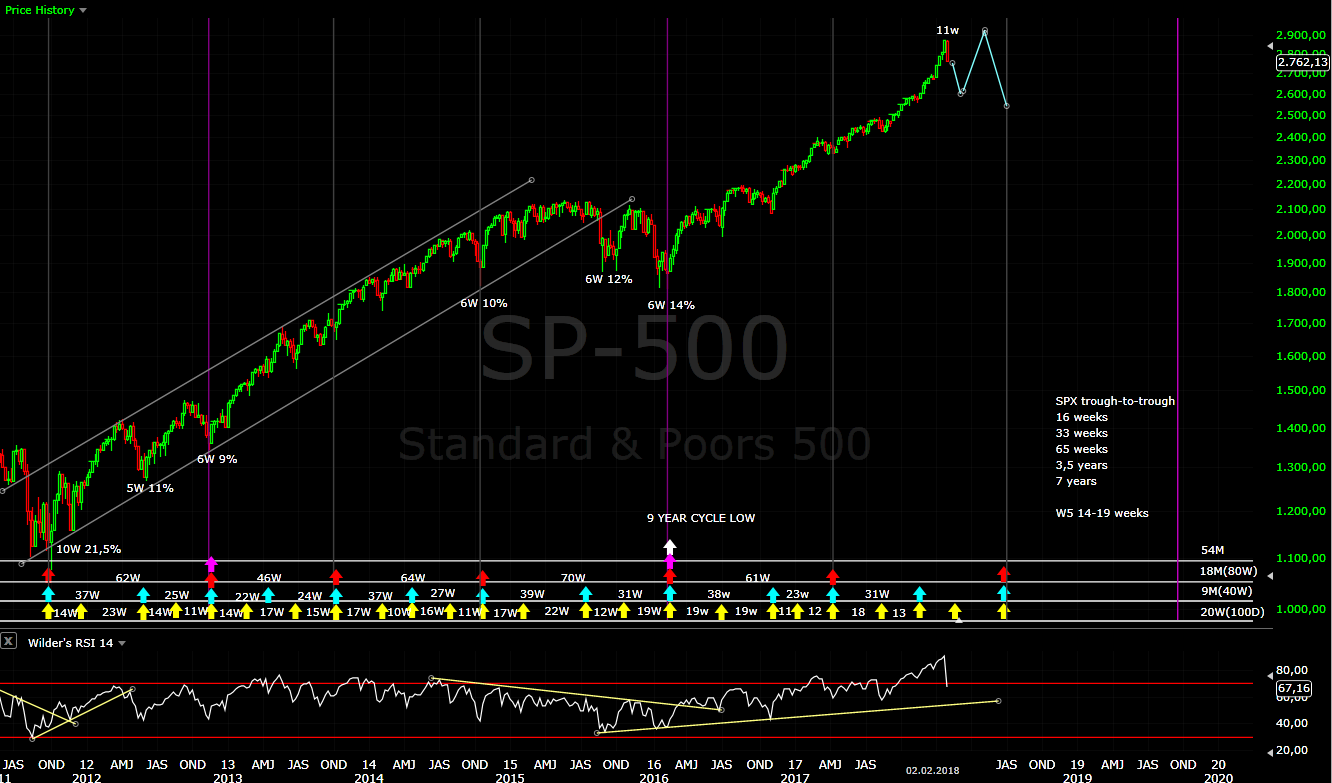
I still expect one more leg higher before a major top. Indexes like DAX and EEM still need one more wave higher and market breadth does not suggest that this is the final top.

MARKET BREADTH INDICATORS
Market Breadth Indicators - are pointing lower, sell signals across the board.... looking at the indicators I would say we need a few weeks before the next intermediate term low.
McClellan Oscillator - reached oversold levels bounce is expected soon.
McClellan Summation Index - sell signal.
Weekly Stochastic of the Summation Index - sell signal.
Bullish Percentage - turned lower with sell signal, but well above 70.
Percent of Stocks above MA50 - sell signal, pointing lower and below 75.
Fear Indicator VIX - break out of the wedge.
Advance-Decline Issues - lower for weeks, but still not oversold.
HURST CYCLES
Day 23 of the 40 day cycle. It turned lower, the price broke below the cycle trend line and MA10.

Week 11 of the 20 week cycle. Given the sell off on Friday it should be heading lower already.
Krasi, what is your view on HSI?
ReplyDeleteIt looks like the same pattern like the other indexes wave 4 and 5 to finish the the move from Feb.2016 low.
DeleteHi Krasi,
ReplyDeleteElliot wave groups are counting the current move down as the complete wave 5 and first leg lower. What do you think?
When looking at current trade, would you trade this down turn or wait for retracement to enter?
Your thoughts on soxx and xbi would be appreciated
Kali
Any index I look needs one more wave higher for a finished pattern. I do not think this is a major top.
DeleteCurrently short are interesting only for a day trade. The next low risk trade is when we see a finished impulse and corrective bounce from MA50.
XBI looks like impulse lower probably a day or two to be finished then corrective move higher.
SOXX nothing interesting so far only three waves at MA50. I think it will move lower, on the weekly charts ugly candle and pattern with divergences.
Hi Krasi,thanks for your analysis on the SP500,i appreciate very much your work. I ask you a view updated on the Eurostoxx Banks Index in the next two months,because i think it's possible a stronger downside till the 113-114 area before the resume of the uptrend: do you think it's possible? Paul
ReplyDeleteThe move lower looks like impulse, but one more low around 116 is needed for confirmation. If we see it corrective move higher then lower again.
DeleteIf we have just a corrective move from the top zig-zag to around 113-114. If this is an important top lower to support around 110.
Krasi uvxy thoughts and thanks
DeleteTopping between the current level and 15 and then lower to the 10 area.
DeleteThanks that what I'm thinkin
DeleteHi Krasi
ReplyDeleteI have a question regarding the upcoming downturn and the rule of alternation. Should we expect a more gradual bear market as an alternation to the sharp zigzag decline in 2008? Or should we rather consider the 9 year running flat correction after the completion of the long secular bull in 2000 and expect a more violent zigzag move as an alternation to that flat? Thank you for your great work
Kris
The rule of alternation applies for corrections in the same wave. What ever we see on the downside is not in the same wave with the downturn from 2008 or the whole flat 2000-2008 so I do not think this rule has any meaning in this case.
ReplyDeleteThe next important low is 4 year cycle low October 2019 or later and if the bull market from 2009 is over target is at least the support level 1800-2100. I have time and price target this is all I need to know.
Than I will watch the EW pattern developing for entry/exit points.
how about GDXJ? it should finish corrective move down and begin go up again? But the problem is XAUUSD still looks like more move to the downside? Thanks.
ReplyDeleteGDXJ retraced enough to finish a corrective move, but the USD and Silver does not look 100% ready.
DeleteI can not say now is the bottom or it will retrace a little bit more or make a higher low when XAUUSD is ready. On such shorter time frames the forecasts are not so precise, but yes we should see one more leg higher.
Now SPX has been hit 2720 level... So this is short bottom and wave v finished? or A larger degree 4 and 5? Thanks.
ReplyDeleteWe have one big hourly bar, if this is iv of 3 or 4 is difficult to say. I suspect it was 4 and 5 and I have closed half of my shorts.
DeleteNow SPX seems still not bottom yet... Any potential short term bounce? Thanks.
DeleteI can not predict flash crashes.... I think it is a short term bottom. It looks and feels like August 2015 and Mai 2010 - bounce and one more lower low.
DeleteKrasi uvxy thoughts and thanx
ReplyDeleteI think this is a top for UVXY. Usually it makes a top at max fear and for me this is now. Even if the indexes make one lower low before a bounce I do not think UVXY will move higher....
DeleteUvxy trading 30 plus in after mkt
DeleteXiv trading in
Does anyone know what happened to xiv
ReplyDeleteAnd what will happen to uvxy
I have read a few times that if VIX doubles in one day XIV will be 80% or more lower and the ETF will be liquidated.
DeleteNow the correction has been deeper than the above short term chart. Any update for the intermediate term charts? weekly MA20 2650 could be potential support? Is the current down move wave IV or wave A in terms of weekly charts? Thanks.
ReplyDeleteThis should be wave A, see the new post.
DeleteDo you think the volatility could change in long term? i.e. we are moving from low volatility market to high volatility in general even if the potential long term wave 5 plays out?
ReplyDeleteYes, the market already switched from low volatility market to high volatility.
DeleteSuppressing VIX one year at 10 comes as boomerang back with vengeance. A few volatility ETFs will disappear, retailers will not touch it for a long time and the hedge funds will adjust their strategies. For me it is over with short volatility, forget about the fifth wave VIX bottoms earlier before the top. I have wrote a few times that VIX will start making higher lows and in the last two weeks it was screaming danger.
The market will top first half of 2018 and move lower until the end of 2019, accordingly VIX will make higher lows. It has already begun.
"forget about the fifth wave VIX bottoms earlier before the top." So do we still expect long term fifth wave? But short VIX would be gone...? Then UVXY can be much profitable?
DeleteUXVY has no history in a bear market. I can not say how it will behave, but I doubt it is like XIV buy and hold. What I see for this few years you have to ride the fear spikes, because when volatility comes down(NOT the SPX is over with the correction this is different) and it loses value rapidly.
DeleteShort volatility is dead, but this does not mean VIX at 50 and stays there. It spikes an returns to normal values(even if the correction is not over) for example 15 and stays there until the next leg of a correction. In the mean time UVXY loses value. XIV is not dropping when we have sideway move, but UVXY is dumping steadily even if VIX is not moving lower just doing nothing... and this is most of the time.
Look at VIX in 2008 how long and how high the spikes were and you will know when to buy and how long to hold UVXY.