Happy New Year!!!!
I wish you successful year and good luck trading in 2020.
The current view for the next 6 months:
- Stocks - final wave lower to finish correction lasting more than two years and 4 year cycle low.
- Bonds - to finish a correction and one more high for 4 year cycle high.
- USD - one more leg higher to finish the move which began early 2018.
- Precious metals/miners - final sell off for the 4 year cycle low.
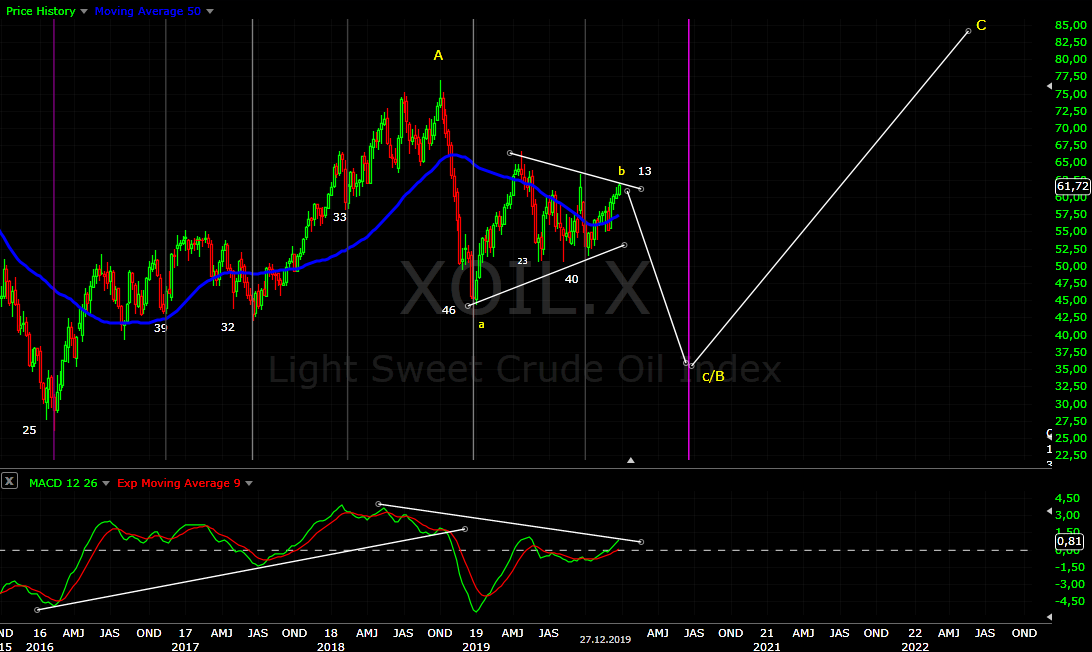
- Crude Oil - final leg lower to finish B wave and 4 year cycle low.
2020 should be an important year - all asset classes are aligned for final rally/sell off and 4 year cycle lows/highs.
- STOCKS
The bigger pattern which I am watching from 2018 is a flat correction for wave IV from 2009. We saw a-b-c/B in 2019 with C to follow in the first half of 2020. Completing expanded flat mid 2020(4y cycle low) will satisfy perfectly the 38% proportions between wave 3 and 4 both time and price. SP500 is stronger than other indexes and now everybody is convinced this is third wave... well it is not. Quick look at other indexes and it is pretty clear what is going on.
For this who want to see impulse you need 1-2 i-ii count - not very likely the first leg is corrective and the supposed w2 is shallow sideway move which is usually b wave. Or you can count w1 of a huge ED for V.
- BONDS
We saw a few months higher and correction in the last 4 months as expected.... but 4 year cycle high at month 37 is too short. More likely we will see the correction finished in 2-3 months and one more high to finish the 4 year cycle. Probably risk off trade the money moving from stocks to bonds - safety when the indices decline in third wave in Q2 2020.
10 year yield - final plunge and correcting higher is running as expected. Next we should see 2-3 months higher for the correction to be finished and turn lower again.
- FOREX
Six months later I can only repeat the same - the pattern is very challenging:) Many see the USD plunging lower and PM to the moon, but I sill think there is one final rally for the USD in 2020.
The USD bears see a-b-c with c diagonal and sharp plunge, I think this is A-B running and we should see C next year. The count is difficult it could be something different, but the idea is one more rally in the next 6 months.
JPY - very messy pattern with zig-zags higher and 4 year low expected next year so I will stay with the call that we have more to the downside.
USD/JPY - mirror image...
- GOLD/SILVER/MINERS
We saw the PM sector higher in July/August and turn lower as expected. The move higher was stronger than expected and the decline is corrective... how looks the long term picture now? The consensus is we have a break out and third wave for gold - I do not think so, the PM sector is in secular bear market. Do not get me wrong, gold will most likely test 1900, but this will be c/B and not wave 3.
For now lets focus on the next 6 months and I think the direction is lower for 4 year cycle low next year.
Gold - it is obvious why everybody see impulse 1-2-3=1,618x1,4 and now 5 running(green). I think we have a-b-c higher and now a-b-c lower is running. If I am wrong we will see higher high and again multi month correction. This will have implications for the bigger pattern, but I still think this is not the beginning of a third wave.
Silver - a look at the bigger picture suggests we should see final sell off to complete third 18 month cycle for 4 year cycle low in Q2.2020.
Gold miners - the same idea like stocks and PM - decline for 4 year cycle low. Cycles look pretty good - two 18 month cycles, 40w cycle low in October and now 20w cycle running. Move below the October low will mean the last 40w cycle turned lower and GDXJ will decline into 4 year cycle low.
- CRUDE OIL/NATGAS
I was not sure what is going on, in the middle of something corrective and six months later crude oil did not disappoint:) - very ugly corrective pattern. We should see one more leg lower to finish B wave and important cycle low.
The pattern is not easy... I am wondering if it is a triangle for b/B(better visible on brent oil)... anyway one more sell off is needed for finished pattern plus cycles point to important low next year.
Natgas - similar to crude oil it seems that Benner cycle sequence 11-10-7 works better than Hurst cycles. History is too short, but it seems to work good - HIGHS - 90(7)97(11)2008(10)2018(7)2025 / LOWS - 92(10)2002(7)2009(11)2020(10)2030.
Next important low is in 2020 which fits with the EW pattern.
I was expecting to see b/B wave higher... we have a zig-zag higher. Now we should see c/B lower.


Thank you
ReplyDeleteKrasi, from where the lower line is come? If they arrive to 2200, they break the long term canal that came from 2009
ReplyDeleteKrasi, on another EW blog I follow, he is proposing another wave count to push back the imminent B wave top. He has the B wave high in spring at around 3400. Is this B wave allowed to go that high?
ReplyDeleteI have not found fix rules for expanded, but usually it is 123% or 138%. It is nearing 161,8% and beyond that 3400 it does not sound reasonable to me. The bigger problem is this will not fit with time(cycles).
DeleteThat sounds like a major problem in EW. So an expanded flat can just go on and on without rules or guidelines? Sounds like a last attempt for the EW analyst to try and make the pattern fit.
DeleteIt does seem odd that there are not more strict rules for them. There must be EFs going on everywhere across all timeframes across all tradeable assets for the last 70 years to allow enough data to write a rule or two about them. I'm finding it odd that this elusive B wave is 400 points higher than most EW practitioners have expected give or take. Can ye all be wrong together?
DeleteWell the ideal target for wave (3) has always been 3300. 3338 to be exact. Maybe even 3400 with the extension. It's been like that since Jan 19. Unfortunately I have been told I'm an idiot, troll who can't count. Sure looks awful close. If it keeps going up they will all change their tune soon (some even acting like they new all along).
DeletePost a chart I do not want to hear excuses when you are proven wrong with your third wave.
DeleteWhat blog is that?
ReplyDeletehttp://studyofcycles.blogspot.com/
DeleteThanks
DeleteThank you for your ongoing analysis and thoughts.
ReplyDeleteOn Gold; as you point out we could be in W.5 up. To me that would be W.5 of C (W.A high in 2016), then that concludes (B) and we start multi-year (C) down. What do you think of this scenario?
This will happen later in several years not now. This a-b-c you are referring to is just a/B.
DeleteFair enough. If it is a/B, same idea that we go up in W.5/a/B, than presumably start b/B?
DeleteYes, it is possible.
DeleteKrasi, I'm on EWT and there's member there who's been right on top of things with cycles. She sees a cycle top next week and in April. Would you know if she's using Hurst cycles or something else?
ReplyDeleteMaybe if I see her comments... in terms of time I was expecting a high next week and in May not much different.
DeleteYour long term EW count is wrong imo. We have already topped in a major cycle in Oct 18' completing 5 waves from 09' low. we are now a large degree correction.
ReplyDeleteANY kind of market prediction is hazardous, especially about the future.
ReplyDeleteBut I appreciate your sticking your neck out each week and defending your outlook.
Good trading to you in the year ahead. And don't forget, duck and cover!
Thank you and good luck for 2020
ReplyDelete