The cycles suggest short term we should see another 1-1,5 weeks higher and long term this should be important top - 4y cycle high. The minimum is a few weeks decline for 20 week cycle low late February/first week of March.
Crude oil with reversal at week 38(high-to-high) the previous time in April 2019 it made a high a week before the indices... which are now at week 36. TECHNICAL PICTURE and ELLIOTT WAVES
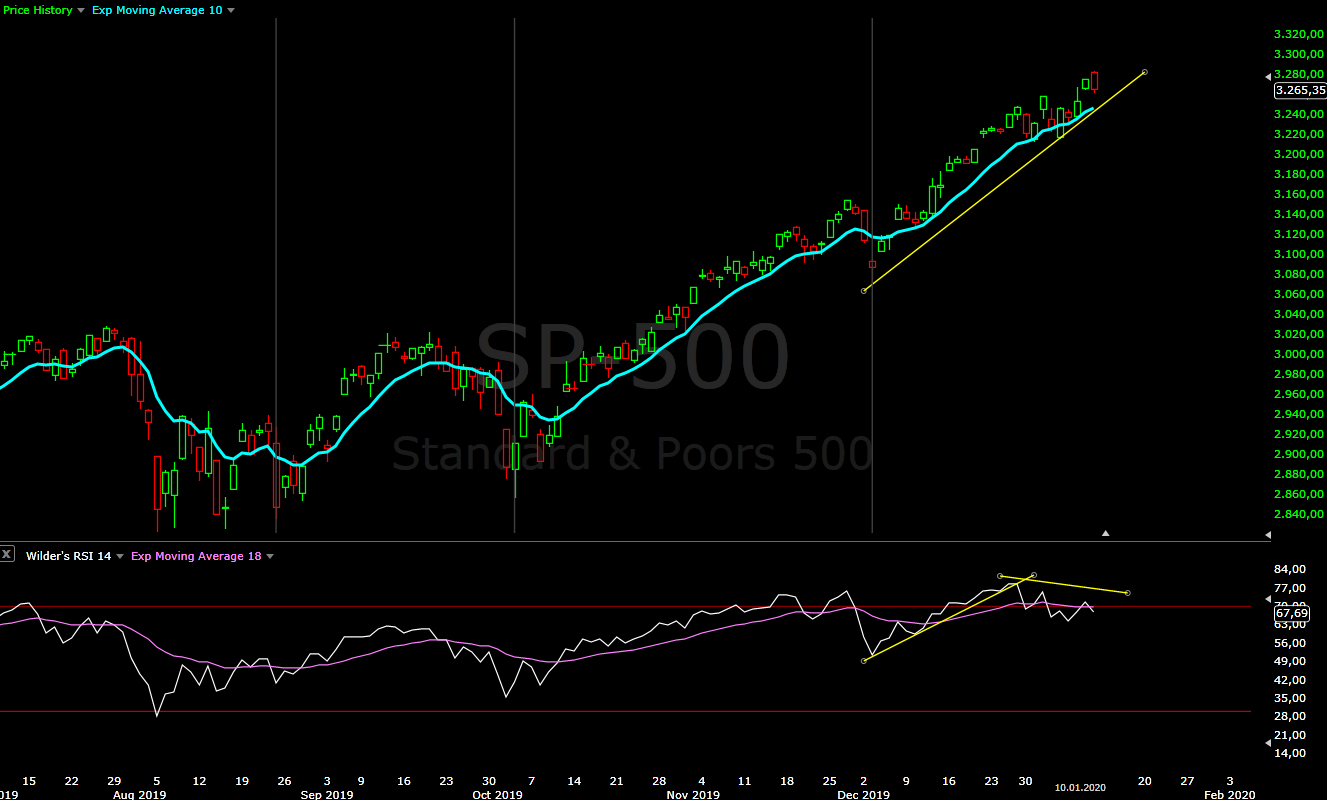
Short term - w4 was finished on Monday, but of higher degree and now in w5. RSI shows very weak move and divergence which fits with wave 5 price action. At least one more high is needed for impulse(white), but I think it will stretch in time probably as ED(yellow).
Of course impulsive break below support will mean the move from October is finished.

Intermediate term - I have changed the count with triangle for b/B because the futures are showing much bigger decline for this w4 and with this count they are in sync. A triangle pattern will explain 40w low in October despite the higher low.
From October we have an impulse with wedge shape, but no overlapping. The first wave was roughly 40 trading days, the third wave 20 trading days and if the fifth wave is 10 trading days it will fit perfect with another 1-1,5 weeks higher for 20 week cycle high(see below).
Usually the wedges/ED retrace to the point where they have started, and this is exactly what should happen if my EW and cycle count is right.
Now we have RSI divergence which is much better for an expected intermediate term high.

Long term - close to the top of wave B, after that expect sell off to begin and to continue into Q2.2020. It will complete the correction which begun in January 2018.

MARKET BREADTH INDICATORS
Market Breadth Indicators - the same... only the bullish percentage is ok the others do not follow the price higher.
McClellan Oscillator - oscillating around zero, with multiple divergences.
McClellan Summation Index - buy signal.
Weekly Stochastic of the Summation Index - buy signal, in the overbought area and waiting for turn lower.
Bullish Percentage - buy signal.
Percent of Stocks above MA50 - turned lower and short term divergence.
Fear Indicator VIX - higher lows and double divergence...
Advance-Decline Issues - pointing lower with divergences, needs to break below the trend line to confirm reversal.
HURST CYCLES
Daily(trading) cycle - the price is above MA10 the signal is still on buy, RSI with double divergence oscillating around MA18 - the cycle is getting weak and should turn lower soon.

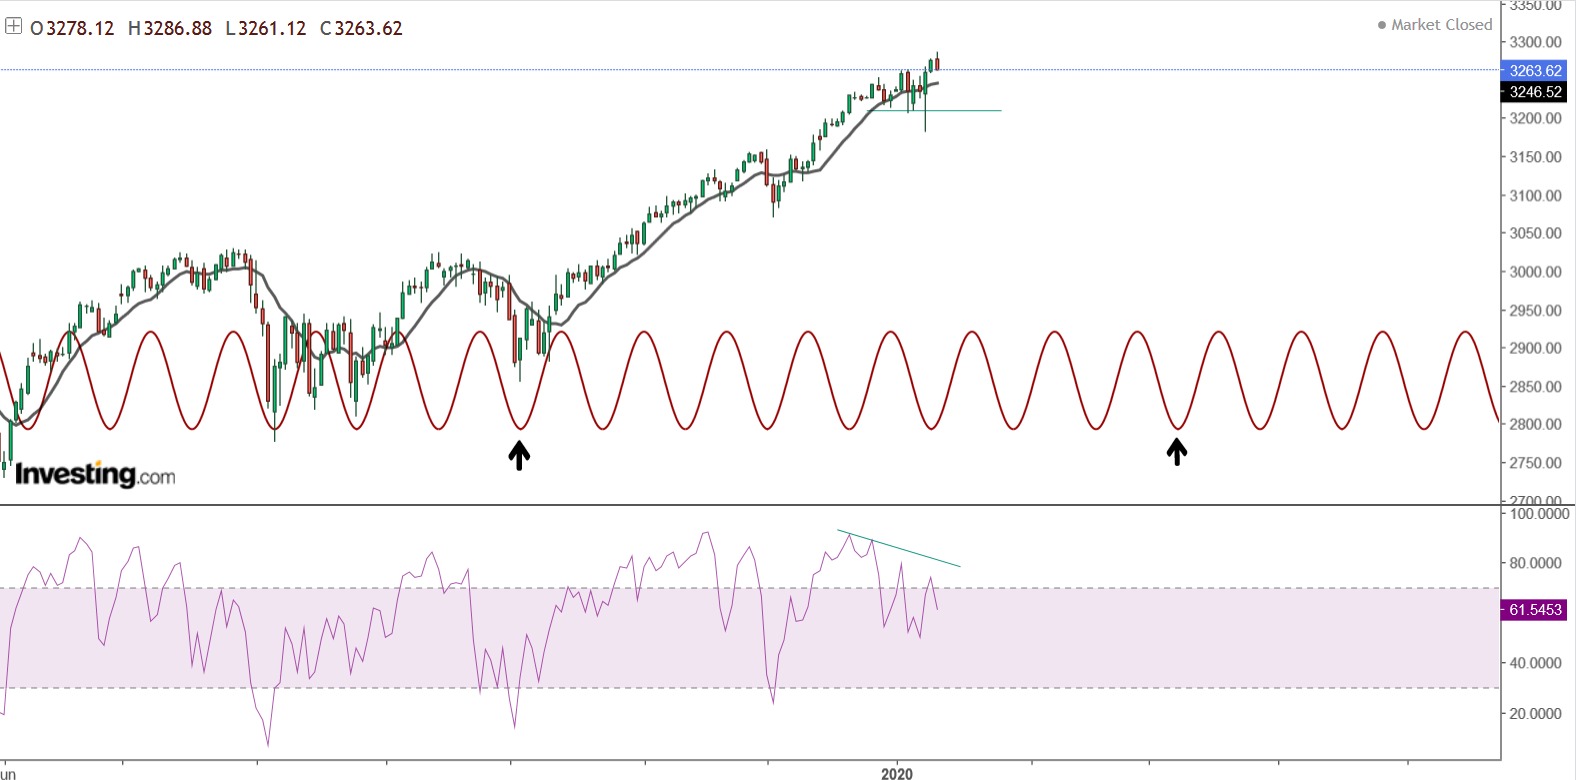
SP500 lows the last 20w(black arrows) cycle with 20d sine wave. It looks like we had another 20d cycle low early this week. Counting eight such cycles point to the first week of March.
DJ lows 40d cycle. I find it interesting that if you synchronize the sine wave with the lows and slightly longer cycle 32 trading days instead of 28(for SP500 above with a low in October are slightly shorter), four cycle for 20w cycle point to the same time frame - the first week of March.

Week 14 for the 20 week cycle, week 36 for the 40 week high-to-high cycle.

Friday's day action constitutes a HOOK REVERSAL. A higher high than the previous day (which was rejected) along with a lower close than yesterday. A TEXTBOOK REVERSAL signal
ReplyDeleteYes, but we need confirmation because this could be just short term reversal. Candles have predictive power of a few days.
DeleteAt this point it send Apple is dictating the market movement. It had a triangle on the 15 minute chart which broke up at the end of the day on Friday. Seems like a final wave 5 up is in the cards. Thanks for your analysis.
ReplyDeleteEdit - at this point it "seems"
DeleteWatching most of the stocks which I track one more high is still in the cards. AAPL looking at the hourly chart it looks like iii/5.
DeleteDefinitely the tech stocks pull the SP500 higher, the other indexes are not so strong all with normal flat correction.
Your man Avi thinks this is going straight to 3800+ after a small correction, any thoughts?
ReplyDeleteMy thoughts are explained above.
DeleteWhy do you think he changed his mind on this now not moving down to 2200, we had similar long term view before, albeit with differences on how it could get a there. Looks like he has changed his mind based on such a strong move higher in recent months
ReplyDeleteWe had similar = ye had similar
DeleteSimple - waves does not really matter, it has to fit his Fibo pinball... just place the labels somewhere.
DeleteI have seen him many times counting complete nonsense, ignoring waves just to fit the price action and it never worked.
krasi short term target on uvxy thanks
ReplyDeleteI think higher around 12,15
DeleteThis wave B is going up too much, almost to 161 of A, I think it is too much for B wave. In addition the future C could not be greater than A, so it is difficult to see 2250, it is easier A = C then C around of 2600
ReplyDeleteRunning flat is an option although rare.
DeleteVertical up move and more and more compressed in time decline means scary decline... I would say something bigger between the Feb/April.2018 and Dec.2018 lows.
Higher high today so the ED option is not very likely.
ReplyDeleteWatching simple impulse from the first chart or one more extension similar to NDX which shows very good Fibo measurements - https://imgur.com/a/l6GVud0
So you think we get a pullback starting tonight/tomorrow? Thank you
ReplyDeleteYes,small pullback will fit good.
DeleteKrasi, where do you think apple is in the count as of the close today?
ReplyDeleteIt looks similar to NDX to me(the chart above) either 5 or iii/5(this one more likely).
DeleteWith vertical moves is always the same - wait for initial plunge and subsequent move up lower high or higher high with divergence. This works always and much better than trying to guess the top....
No news, no Elliot, no canal, up forever
ReplyDeleteYou will make money when you close and you will never close because "up forever".
DeleteYou will ride it all the way lower because I am wrong... stupidity of the sheeple falling in love with a trade because "up forever".
LOL yeah OK. People never sell and take profits. Do you understand how the market works? You can't buy shares unless someone is selling. That person selling is making money. In your imaginary world no one sells because it goes up forever. Well guess what your wrong just like your count. I give up on this place. Goodbye and good luck to anyone reading this. You will continue to need it.
DeleteYes, smart money is taking profits and making money and the sheeple like you are buying and believing in fairy tails up up forever.... at the end holding the bag as always.
DeleteGo gather with the other sheeple singing kumbaya that is much better, my count is wrong anyway:)
Printing forever
ReplyDeleteWhat happened did they stop printing?
DeleteIt looks like we have the white 5 from the first chart....
ReplyDeletegood luck with that
Deletewe finished that white wave 5? I hope so, I'm short
DeleteStill waiting to see finished patterns for the futures, AAPL, European indexes - final v/5 is missing there.
DeleteGood luck believing it will continue higher and nothing works any more because XXXX pick your fairy tail.
DeleteNo. Krasi just got excited over a news event.
ReplyDeleteWhere do you see excitement? I only see the sheeple exited up up forever, FED is printing for 5 points higher.
DeleteKrasi, the weekly VIX bands are compressing. If they continue to, the bands are going to blow out like they did in Feb 2018 or end of 2018. There's a big move coming.
ReplyDeleteThey can compress for weeks (or even months), but yeah, prices are getting stretched
DeleteYes, but it depends again from the pattern, in 20017 it was compressing for a whole year... until the pattern was finished.
DeleteNow we are close to the top of B so it want last very long before seeing VIX exploding higher.
Very possible...difficult for these indicators to be reliable with balance sheet expansions though
DeleteKrasi, I was doubting the B wave scenario, but with the Buffet indicator at all time highs, even higher than the tech bubble, the setup is there.
DeleteBuffet indicator is total stock market cap divided by US GDP.
So we are in a bigger bubble than the tech bubble.
Buffet indicator says a negative 3 percent a year from this level of valuation. Question: How much further can an expanded "B" continue before it is rendered invalid?
DeleteI don't have Neely's book, but it's answered in there. I'm going to look it up, what happens when a B wave is beyond 1.382 x A. Maybe Krasi can answer.
DeleteB can expand to 2.618, if it expands beyond 1,38 C should make higher low running flat or triangle.
DeleteIt was discussed above and I will show it this weekend.
Appreciate it
DeleteShort just if the vix more than 16.5
ReplyDeletelooks like top, apple cracking. Yes, I'm probably wrong
ReplyDeleteAAPL is ok for one more high v/5 and the indexes to finish ED and Europe too.... patience a few days.
DeleteI think B 161 of A as much
ReplyDeleteYes, exactly 161... NYSE is slightly below 123 and DJ slightly above 138.
DeleteLast week I was talking about that we have an impulse with a wedge shape and Fibo proportions like ED, but no overlapping... and the degree of the waves does not fit what the most count 1-2 early October.
ReplyDeleteI have changed the count to reflect this and after a quick look in the theory books the "mystery" is solved - the pattern is impulse with extended w1. Textbook shape and proportions. I have seen plenty of w3 and w5 extension, but not w1... it really fooled me:) I did not expected this.
Short term the ED(yellow) is playing out after all.
It looks finished on the futures with short term divergence and intermediate term between w3 and w5 - https://imgur.com/a/v7WeHcr
The cash index needs one more high - https://imgur.com/a/d8fiTfU
Now I am getting excited:)
Never is ED :(
ReplyDeleteLast January 2019 it was a 80% probability of w3 to the 3300 area. Today we are there. A year ago was the time to be excited. This can very well go to 3400-3500 area. You made it very clear to everyone that unicorns would fly before 3300. I guess fairy tales are real.
ReplyDeleteNo offense Krasi but your a little late to the party.
Sure at the low everybody was predicting 3300.... do not forget to come back in few months to explain why your fairy tail third wave went down the drain.
Deletelooking good, small wave 5 yesterday into today if it's true.
ReplyDeleteWe have the required minimum now is waiting... I want to see AAPL making higher high to finish v/5.
Deleteif wave 1 of 5 was jan 6, end of 5 would be jan 14 - not possible?
DeleteYour latest count invalidated Krasi?
ReplyDeleteShort term diagonal if you mean yes.
DeleteCool, upwards we go so
DeleteI do not think there is much to celebrate we are talking about 5 of 5 of 5 - https://imgur.com/a/z7UAqHR.
DeleteThis is DJ but SP500 is the same, thrust from a triangle is terminal move with small iv/v of 5 of c of B.
Krasi, don't you think we have 1,2,1,2,1,2,3,4,3,3 and we have to see a big 4 to 3100, then last 5 and then a big corection?
ReplyDeleteWell, ladies and gents the train is entering the station. Target was 3330/3340 in 3. We are here. Could squeeze up to 3400 so keep an eye out.
ReplyDeleteThe Year is 2092 and the joint Chinese-US space program is about to launch its 12th manned mission to Mars. The SP500 has just crossed 80,000 for the first time. Krasi: we are finally there! The B wave that started when I was in middle school is about completed.
ReplyDelete(no offense, this is supposed to be funny. I was also wrong about the market too last year.. or perhaps I wasn't paying enough attention)
You are really good with EW, really nailed it:))))
Deletehttps://www.elliottwavetrader.net/images/charts/202001/full-218eaee8c1261adf0336cb12c5c5c7ae2a163675.png
wave IV in 2009 is not 1/3 in price or in time of III ...
Deletehttps://www.youtube.com/watch?v=96c1_KsxFzg
ReplyDelete20w mid February?
20 week high next week, 20 week low late February.
Deletethe previous high of 20 was mid-September?
ReplyDeleteYes
DeleteLook at 15 minutes, it's get doun in ABC
ReplyDeletelooks good for a top again, Apple higher high, and they got everyone out who was short from the morning selling
ReplyDelete:)
Have a great weekend Krasi
Thanks!
DeleteYes, everything is starting to align Europe, RUT, DJT are catching up with the missing one more high and many stocks are completing their patterns.
No disrespect but you do say all the indices are starting to align except one which needs one more high and the rigamarole of all going to ongoing ATHs rep we repeatedly for another few months.
DeleteEste fin de semana no te molestes en un nuevo análisis...
ReplyDeleteTodos sabemos que falta una onda al alza.
This might be a possibility:
ReplyDeletehttps://www.youtube.com/watch?v=96c1_KsxFzg