Trading cycle - sell signal, another close below MA10 confirmation is second close below it. RSI is below the MA too, but for confirmation I want to see it breaking below the trend line.

TECHNICAL PICTURE and ELLIOTT WAVES
Short term - NYSE made higher high, DJI only intraday, SP500 slightly lower high - similar to Jan-Feb last year non-confirmations. The move from the November low should be completed, but we need confirmation like brake below the channel and the last minor low.

Intermediate term - the indicators with long and short term divergences warning for a high.
Looking at RSI I think this labeling is better - three moves higher with roughly the same length 11-9-10 weeks.
Neowave pattern diametric completing at 18m high looks good. Classical EW pattern should be W-X-Y(red) with the catch that there is no impulses.
Alternate this is THE top Z/G(white) I do not believe it much, but if we see the last move retraced very quickly like 4-5 weeks we have reversal.
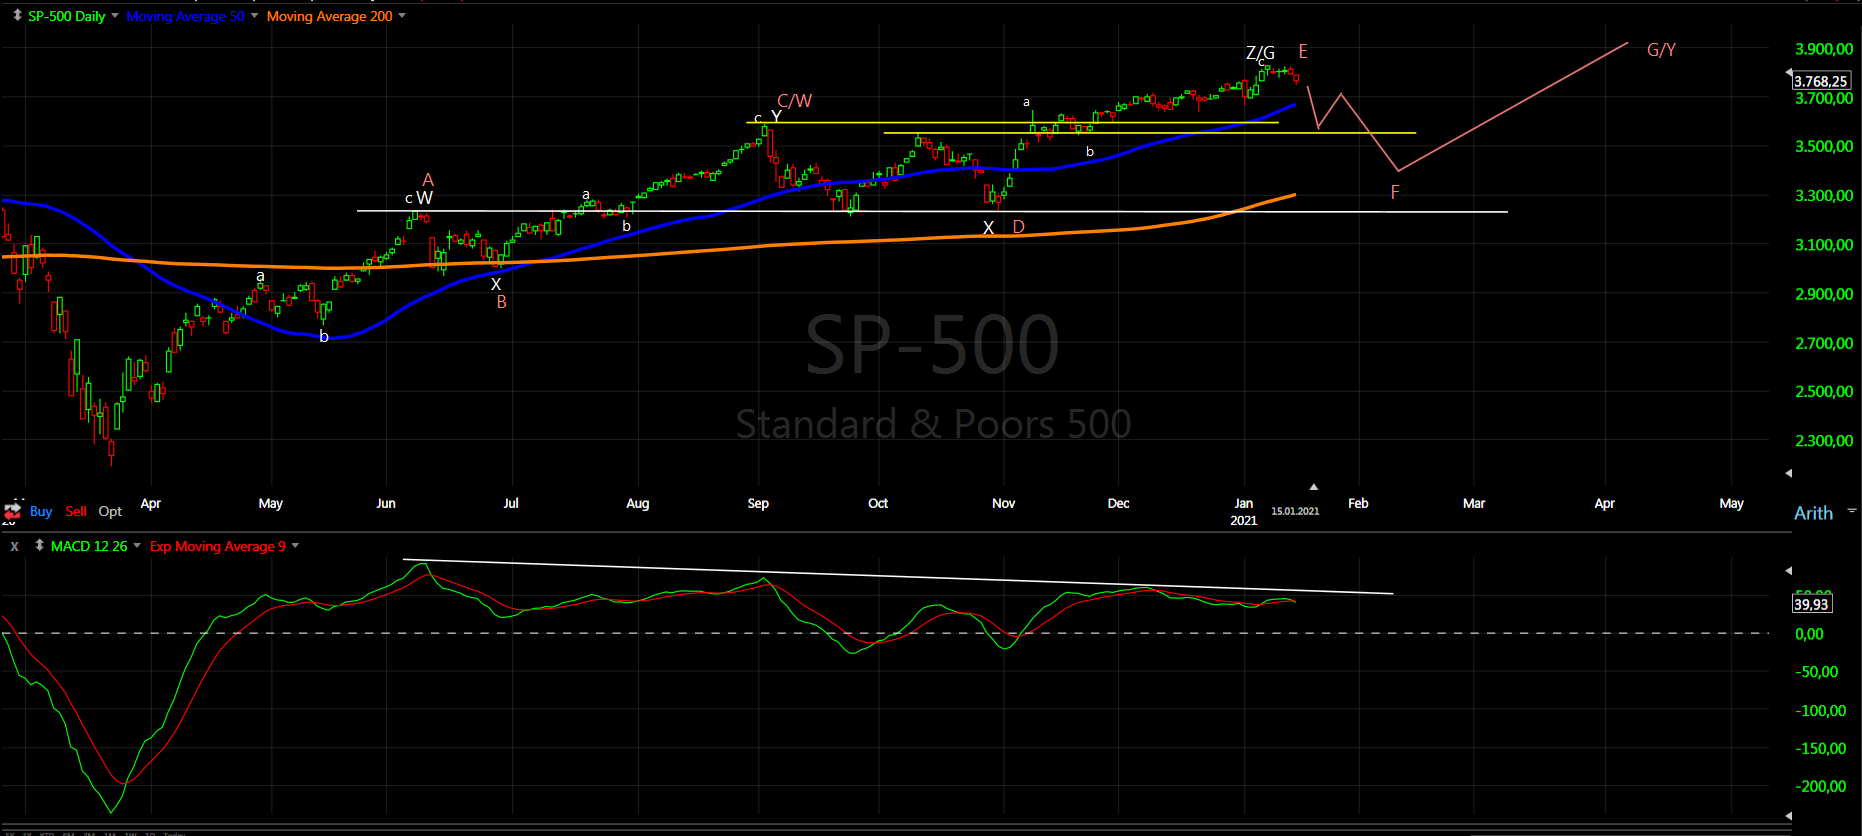
Long term - the bull market completed in 2018. Since then a bunch of corrective waves. Currently I think this rally should be a corrective wave of a bigger pattern most likely triangle. Look at NDX we have corrective wave which is 1,618 bigger than the previous one which could be only b of a triangle. I think the best looking pattern is Neely's triangle.

MARKET BREADTH INDICATORS
Market Breadth Indicators - the oscillators are turning lower with divergences. I think they are pointing to intermediate term high.
McClellan Oscillator - turned lower and below zero.
McClellan Summation Index - sell signal.
Weekly Stochastic of the Summation Index - sell signal.
Bullish Percentage - short term divergence and turned lower.
Percent of Stocks above MA50 - short term divergence and turned lower, sligthly below 75.
Fear Indicator VIX - higher lows, we should see spike higher.
Advance-Decline Issues - turned lower after lower highs and divergence.
HURST CYCLES
Short term cycles - this choppy price action makes it difficult to analyze the short term cycles... this is the fourth week from the previous high so most likely the indices made 5w high and turned lower into 5w low.
Based on the length the 20d low should have been on 12th at day 14. In the alternate scenario you have 17 days for 20d cycle low and turn higher into 5w high.... it has low probability, but can not be 100% excluded at the moment.
I am searching for ways to confirm this short term cycle lows. One possible way I have found is using the McClellan Oscillator. It has this capability to show weakness, which is not visible on the price chart making it suitable for this goal. Those interested in cycles study the chart. It is not perfect, but it seems to work pretty good. It says the 10w low is where I have it and the 20d low is mid this week.

Week 11 for the 20w cycle. The indices are at 20w cycle high and turn into 20w low probably occurred this week.

Although the market will not trade Monday, the currencies will. If the dollar continues to break out, we may have quite a gap down on Tuesday.
ReplyDeleteThanks as always Krasi!
I don't think we topped yet, I'm looking at one more zigzag higher to complete, maybe by end of this month.
ReplyDeleteAlso, there is no way of saying if this is the major top or we have a correction/pullback then rally again into spring/summer which will mark the major top. End of April is a big harmonic for lows. Corrections are very unpredictable and hard to count when they are occurring.
with earnings coming up, and expected to do good esp e-coomerce, lets see where the weakness or some sort of global catastprphe come from.. possibly these vaccines, as it looks ljke to be having adverse effects on elderly.. maybe China again will do something or Iran will.. but at the moment dont see anything will cause a big 10%- 20% drawdown..
ReplyDeleteim ready in any case..
But lets see..
The markets just decline reason is not needed. The media will find some reason.
Deletei agree..
DeleteI am a student of Elliott wave theory. I have been backtesting the market using it's principles and I have found many anomalies that don't fit with EW theory. For example, there are many examples where the 5th wave subdivides into 3 waves not 5, this is apparent in the 08-09 correction and the 2011 correction as well as many other instances in the market. I have also seen corrections with a 5-3-3 pattern, for example the 87-90 correction seen best on DJT or VALUG indices. These patterns seen in the market make EW theory flawed and make EW theory require a revision, I was wondering what you think of that?
ReplyDeleteI think this is correct. Concrete for this move from the March low I wrote once either you have to use something modern like neowaves or classical EW needs update.
DeleteI do not have the resources to make extensive research what kind of new patterns there is, but you can look at Neely's work.
They have to break the canal that still support
ReplyDeleteLatest update from Neely now says he thinks we're close to a top with a large C wave coming. Not sure how close "close" is.
ReplyDeleteIf it is the C wave of the triangle this is my alternate scenario... because of cycles I have it as alternate.
DeleteRoberto Mattheus, where can I find the neely update?
ReplyDeleteIn my email box
DeleteAre you subscribe?
ReplyDeleteCan I also get it too?
eh, I'm not going to share the chart. What I said is enough
DeleteI'm not ask you for the chart, I'm assuming if you subscribe, if you pay him?
ReplyDeleteyes S
DeleteIf you want NEELY's predictions watch his youtube presentation https://youtu.be/5iaps9PSrfM
DeleteHe is not as bearish now (probably cuz he reeled in more subscribers) but his charts have not changed.... same BS..........
Thanks
ReplyDeleteNice blast higher today!
ReplyDeleteTop canal
ReplyDeletequite a drop at the close and AH, let's see if futures can keep it up. Krasi, it's the 20th - I can't find it but didn't you say the 20th was important regarding the cycles?
ReplyDeleteNo, it was someone else for 5w high...
DeleteCurrent thoughts - last week showed DAX with short cycles because of more clear picture, I still think this is the case - https://invst.ly/tjct6
ReplyDeleteAnd the same for the SP500 - https://invst.ly/tjcq5
In a diametric in bow tie B>62A, in a diametric in diamond B<62A, I don´t think that count is right
DeleteAt what point does your ABC, bull market ended in 2018 theory become invalidated, if this is now rising to 4000?
ReplyDeleteB>2.618xA
Deleteno idea what shape the eventual correction takes , but agree with those charts - S&P 4100+ only a sniff away now and we haven't had a proper blow off yet for wave 5/e .
ReplyDeleteHopefully a top by April/May will be possible . Until then , day traders only need apply.
Chop until late February for 20w low, blow off mid April 18m high, 4100 is the 0.681 Fibo extension for the second leg so this is the most likely target - this is the plan.
Delete4K it's only 4 percent
ReplyDeletehttps://www.hussmanfunds.com/comment/mc210118/ worth a read imo
ReplyDeleteDo you expect the 20 week low to be around 3400? Or is there a target range for the 20w low? Thank you for all your work and help.
ReplyDeleteWith this "wasted" time this week probably higher 50% retracement and support 3500-3550.
DeleteI think 3000-3100 because we are in a wave g of a diametric in bow tie from november and this wave must be go back in less time
DeleteFirst we have to see the top, the buyers are still here
ReplyDelete