Trading trigger - testing MA10. Sell if we se turn lower next week.
Analysis - sell signal, not confirmed we have transition from 18 month high into 18 month low.
P.S. - for a trade both analysis and trigger should point in the same direction.

TECHNICAL PICTURE and ELLIOTT WAVES
Short term - more zig-zags lower and higher. I think all this is part of a bigger zig-zag lower.
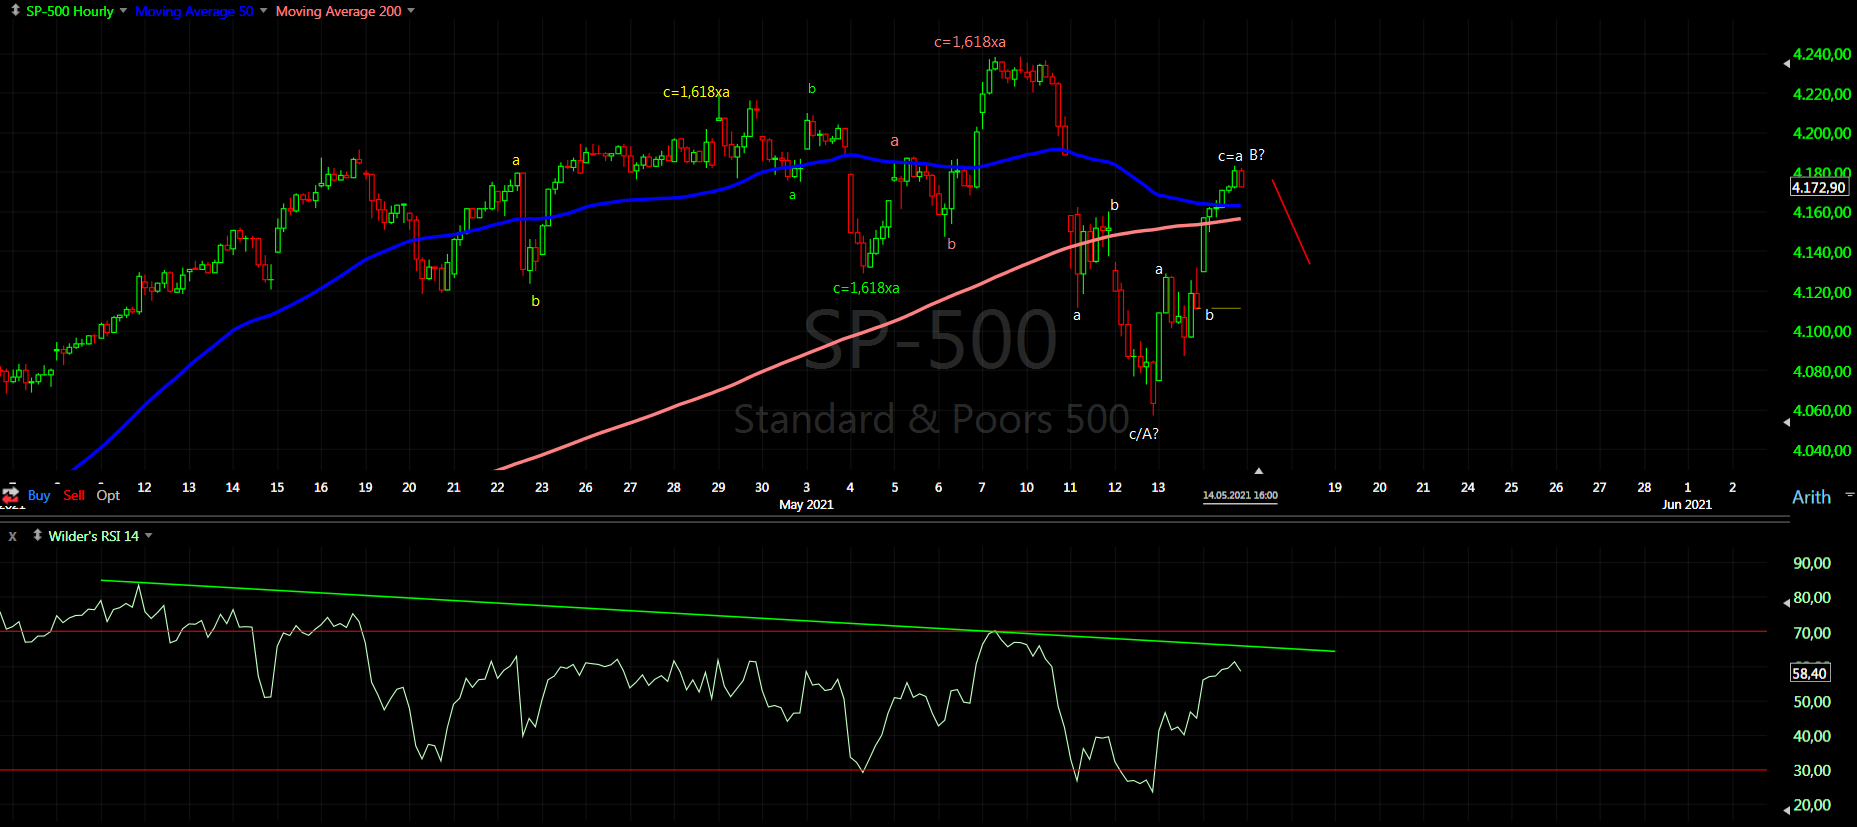
Intermediate term - I see one big zig-zag up consisting of two zig-zags. You can count it as W-X-Y(red) classic EW, but there is no impulses, more likely series of zig-zags A-B-C(yellow). Lower to MA50 and bounce classical TA, now caught between MAs and trend lines. All part of topping process the direction is lower.

Long term - the move from March 2020 is completing and we are seeing transition from up to down. Expect 6-8 weeks lower and we will watch how big the decline will be.

MARKET BREADTH INDICATORS
Market Breadth Indicators - are in sell mode.
McClellan Oscillator - made lower low and broke the trend line connectiong all the lows since March 2020, now retracing and close to zero.
McClellan Summation Index - sell signal.
Weekly Stochastic of the Summation Index - sell signal.
Bullish Percentage - pointing lower, but above 70.
Percent of Stocks above MA50 - turned up, but not close to the previous highs.
Fear Indicator VIX - forming big wedge from the March 2020 high - touched the upper trend line this week and retracing. I expect higher low and break out from the wedge.
Advance-Decline Issues - weak, but still has not broken convincingly lower, at the moment in the middle range.
HURST CYCLES
Short term cycles - it looks like 10w low this week. I wrote a few weeks ago it counts better as three longer 20d cycles instead of four and it seems this is exactly what happened. The highs - the indices are close to 5w high. It is already long enough 20 days/4 weeks... it could turn lower on Monday or it could take another 2-3 days, cycles vary we have to wait.
With the price action this week the model with 18m high mid-April makes more sense it is the one which looks better anyway.

Week 28 for the 40w cycle.

thanks for your posts!
ReplyDeleteHi Krasi, Any thoughts on DAX at present?
ReplyDeleteThe same... in fact I think DAX is showing exactly what is going on - https://invst.ly/uti4z
DeleteLook at the RSI this must be b-wave... maybe triangle
Hi Krasi.
ReplyDeleteWhats your think about Mongol Index?
Too exotic there is no charts, besides you need huge number of participants and volume for the analysis to work.
DeleteHi Krasi,
ReplyDeleteThank you for updating the trading system and posting consistently as always. I will post some questions on that page once I get some time and wrap my mind around it.
I started a blog on my trading as well to help with accountability and process. I am still pretty amateur at counting but everyone starts somewhere.
https://trendtradr.blogspot.com/2021/05/20210515-weekend-analysis.html
Any feedback would be welcome :)
In the short term, I saw 5 waves up with a good wave 2 pullback so once again, I hold my nose and went long over the high of the first wave. The position has a stop at around break even so I don't care as much if the count is wrong and will happily short under some lows. How are you counting the Nasdaq right now? I think it's possible to count it as a series of 1s and 2s to the downside which would be extremely bearish.
Nasdaq is one of the leading indexes and it is clearly more bearish comparatively. This is another indicator (amongst many other divergencies, etc.) that stock indexes are setting for intermediate decline.
Deletethe consolidation hourly is starting to look much more short term bullish after monday.
ReplyDeleteKrasi, time scale is important for you. With SPX not coming down significantly and time passing, at what point does the analysis change?
ReplyDeleteThe correction is not cancelled it is running. With the time passing the odds are rising that the correction will be the green one on the weekly chart 50%-62%
DeleteI would assume a new ATH. He said last week a new ATH would not fit into his analysis.
ReplyDeleteThis all smacks of consolidation before a nice burst higher to 4400+
ReplyDeleteOr nice burst lower to 3800....
DeleteFine, 3800 then to 4700+. Not 2200
Delete3800 would be a joke after this run last year. Cycles would be completely wrong.
Deletelook at the huge daily bear flag on IWM, they tested the trendline today and failed miserably. See you at the 200ma
ReplyDeleteHardly huge Roberto, you seem to over play your cards quite regularly!
ReplyDeleteOn the daily chart brother, target is 200 ma at least. Stay long
DeleteThe usual knee-jerk reaction from MA50 last week for the fourth time, but this time it is not working so good - https://invst.ly/uv57e
ReplyDeleteThree red bars in a row usually means wave in the opposite direction. The problem is everything is down commodities,stocks,crypto just the USD slightly up - this means we have risk off trade. With high probability the topping is over.
Not GOLD
DeleteGood job Krasi, all time low in the comment section
ReplyDeleteKrasi,do you see double bottom?
ReplyDeleteNo, sideways pattern.
Deleteso far es this is most similar to the september 2020 pull back. 3 days down, bounce off 50ma, another bounce off 50 ma. sept went back to the 20 ma and reversed to go lower and tag the 100 ma.
ReplyDeleteSpeculation at the moment a-b-c lower with b-wave triangle(see RSI) - https://ibb.co/XypYc6v
ReplyDeleteThe same on the NDX better visible - https://ibb.co/v1PzPHv
It is ugly pattern but works for all indices NDX,SP500,DJI and the cycle high was mid-April..... so everything fits. We will know in the next few days.
In fact this is exactly the same pattern which I have posted for the DAX above this weekend.
DeleteAnd the short term charts seem to support this idea - https://invst.ly/uvm8w
Decision time now we have c=a from this chart - https://invst.ly/uvm8w
DeleteAnd the price is testing MA10 again... still trapped between the two MAs - https://schrts.co/EkhWTaAh
If we see turn lower it is time for the last 1/3 short.
4400+. Simples
ReplyDeleteSimple linear thinking and no clue what the charts are showing.
DeleteTbf to me, this chart has been pretty linear for the past 12 months. I'll keep my linear thinking for now and not get excited about 60 point drops intraday that get beaten back up. I do really want you to be correct btw, but still thinking there is more upside to come.
DeleteLOL! It just takes 2 days of gains for people to come out of their bunkers and start the nonsense again.
ReplyDeletewwell, this IS nearing a mere 1% down so the krasi krash is a whimper so far
Deletekrasi: how do you determine today was not a wave 3 of 5 up, the way you count? what says it is not that you can see.
ReplyDeleteSimple there is no single impulse from the March low.
DeleteSee the hourly chart and add two more zig-zags for this week.
thank you
DeleteLOL Roberto strikes again
ReplyDeleteI still agree with Krasi on DAX - answered Sunday - looks basically how he described and now just need the reversal which it looks set for very soon.
ReplyDeleteUp forever
ReplyDeleteThat's exactly what the shorts want you to think but after June 18th we should see a huge drop
DeleteWhy June 18th?
DeleteCycles
Deleteyes but the short investors are among the smartest investors they always get you to buy dip until it dont work
DeleteOn my charts Mid-June is lower high 10 week high then the final wave lower the most powerful one begins.
DeleteThat's 3 weeks away. Does that mean we are rangebound for 3 weeks? I know predicting short term is hazardous, but that seems to be what you're saying?
DeleteNo this should be 5 week high, 2 weeks lower for 5w low and two weeks up for this 10 week high then the final flush lower.
DeleteA lot of zig-zag choppy movement until closer to mid June. The final wave lower shall be very distinct, something like we saw on BTC several days ago.
DeleteImagine being a short investor over the last year. Not only did they miss out on one of the best years ever they actually lost money. I know plenty. Those are your sheep. Blindly following idiots on Twitter like Xtrends. Smart investors haven't been short.
DeleteDefine "lower high" (projected number wise) please. This is the first mention I've heard. Everything has been hard down by end of June. Thank you.
DeleteSomething like lower to 3700-3800 and probably 4000 lower high.
DeleteIt's Louis's birthday on the 18th. :)
ReplyDeleteLouis, your target for the drop of the sp500?
ReplyDeletewe could see 4360s
ReplyDeleteplease explain.
Deletefor drop 10 percent
ReplyDeleteHi Dear,
ReplyDeleteThanks for sharing such a useful blog. Really! This Blog is very informative for us which contains a lot of information about the tradings. I like this post. Please visit at "CFD Spot Energy", I hope you may like our tradings,
Visit Here - https://secure.cwgmarkets.com
Thanks