Trading trigger - buy. More crosses down and up caused by long topping process.
Analysis - sell. Long topping process, which is maturing.
P.S. - for a trade both analysis and trigger should point in the same direction.

TECHNICAL PICTURE and ELLIOTT WAVES
Short term - looks like double zig-zag higher.... probably completing b-wave.

Intermediate term - from the March low we have one big zig-zag consisting of two zig-zags, which itself consist of zig-zags. You can call it W-X-Y, but there is no impulses. Intermediate term the pattern depends on which index you are watching. NDX looks like impulse completing. DJ a-b- pattern. SPX something in the middle - either distorted version of the DJ's a-b or expanding ED... I have never seen one so probably the first option.

Long term - topping process running for months and maturing. Some kind of b-wave and c-wave will follow.

MARKET BREADTH INDICATORS
Market Breadth Indicators - do not react so far to the move up despite the vertical rally and the new highs, oscillators resetting but this is all.
McClellan Oscillator - reseting ater oversold level.
McClellan Summation Index - sell signal.
Weekly Stochastic of the Summation Index - sell signal and reached oversold level.
Bullish Percentage - in the middle of the range, does not shows signs of reversal.
Percent of Stocks above MA50 - in the middle of the range, does not shows signs of reversal.
Fear Indicator VIX - retracing lower after the spike.
Advance-Decline Issues - bounced up from oversold level. The trend line connecting the lows from 2020 has been broken usually this means the next high marks the top.
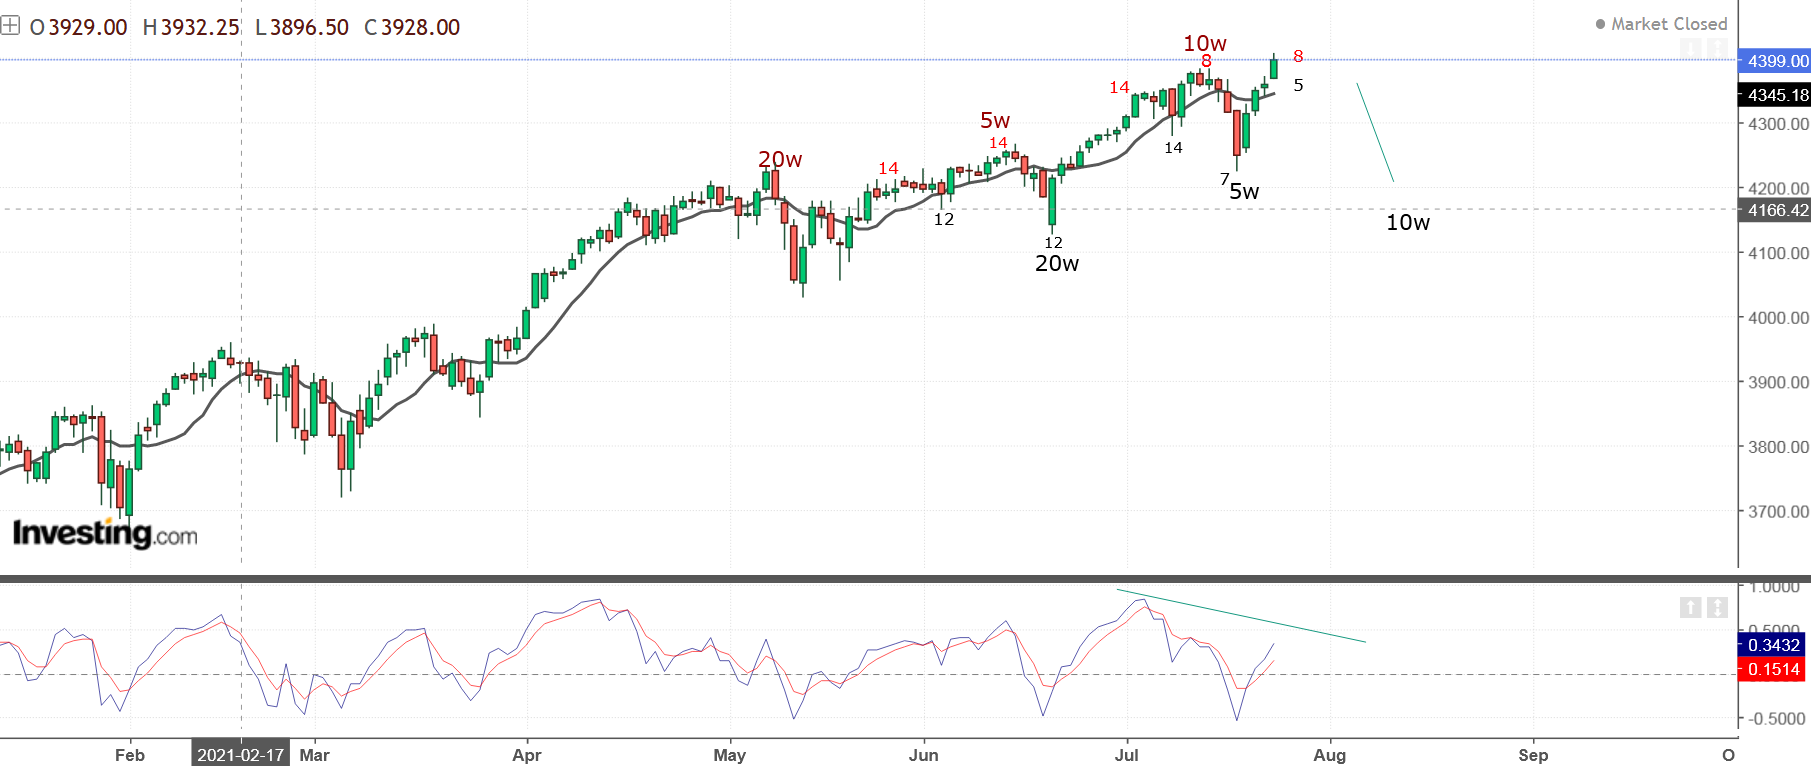
HURST CYCLES
Short term cycles - we saw 5w low and now up into 20d high.
DJ/NYSE make most sense of all indices, which is normal not influenced by tech stocks. The sequence high-low works perfect, the length of all cycles is perfect the only "problem" it does not work for NDX:). Alternate scenarios 18m low in May(40w cycle with length 29 weeks) or 18m low later(40w cycle with length more than 40 weeks) This scenarios have statistically lower probability either too short or too long.
P.S. The weekly RSI+MA9 and MCO seem to confirm this hypotesis.

July ends and there is no minimum of 18 months. the 18 months are in September, you just have to count.
ReplyDeleteObviously you do not have much experience with Hurst cycles.
DeleteThis market is NEVER going to have a correction. Too much Powell Bucks.
ReplyDeleteThis market is toast, dead man walking.
DeleteThere is absolutely no weakness as of now. What do you mean market is toast?
DeleteJust read the comment above - peak mania, peak stupidity, peak everything.
DeleteThe dumbest guys the retail investors think they are gods - just the next generation of bag holders.
We are in the middle of multi month topping process and major top.
Some indices made a top in February, some in April/Mai. All we see is piling in the big five tech stocks (50% of NDX and 25% of SP500) to keep the illusion alive how everything is great.
P.S. I will not start with all the technical staff, when you are blind to see it.
Don't disagree but if SPX just passed 18m low, wouldn't the indices just continue going up for 4year high at this point?
DeleteKrasi, I’m not disagreeing but can you comment more on why you think Powell $$ will not keep this whole thing afloat? Aren’t those $ an anomaly that could explain the market behaving irrationally for the foreseeable future?
DeleteAnonymous - not necessarily. Usually after such moves we see M-pattern some kind of second top - the next cycle makes another high and reverses early in the cycle.
DeleteWe saw it in 2020 and we are seeing it now, but with longer cycles.
Dave - No one can control the nature/chaos. It is an illusion that FED can control it.
DeleteThe FED is private organization for profit and they do not care about economy or stock market. It will be more profitable for them to let it crash like 1929, they do not care about average Joe. They are cashing at the top convincing the sheeple they will always be there to save them.... until they are not like in 1929. You have to be very stupid to believe the bangsters.
Looks like crude was a bear trap!
ReplyDeleteDepends on the time frame you are interested in.
DeleteIntermediate term the 18m cycle looks clear, expect multi month correction - https://invst.ly/vku6j
Krasi, dont you think from 2018 we see a, b, c, d, e and now the fifth wave?
ReplyDeleteThere is no impulses... from 2009 there is no impulses all corrective.
DeleteThe Amazon bulls talking about a breakout with no volume and monthly bear divergences. See you at 1k
ReplyDeleteI think you have the right idea, but I would add the next top after the August pullback could occur anytime from fall to 2022. Cycle tops are hard to predict and you made the mistake of predicting this current top 4 months ago.
ReplyDeleteThe 18m cycle top is right on time well visible on many indices - NYSE,DJ,DJT,XLF etc. The analysis is fine. What we are seeing is the reason why the Hurst theory does not have high to high analysis, because the top is a process and cycles with different length make a top at different time.
DeleteOr more simple said 5 stock which are 50% of NDX and 25% of SP500 are being used to keep it looking great.
The next top you are referring is the test of the high which I am showing on the weekly chart - the next 40w cycle high... I guess after the holidays in Jan.2022. This will be the sixth 40w cycle high from Jan.2018 so this could be the 4y high... no idea higher or lower high.
What is your opinion on the Hong Kong HSI? Is it bottoming?
ReplyDeleteYes, but it will be perfect pattern and cycles to see one more low with divergences.
Delete