Trading trigger - buy. At the moment I think it is more likely to see support around MA10.
Analysis - sell the rips, long topping process.
P.S. - for a trade both analysis and trigger should point in the same direction.
TECHNICAL PICTURE and ELLIOTT WAVES
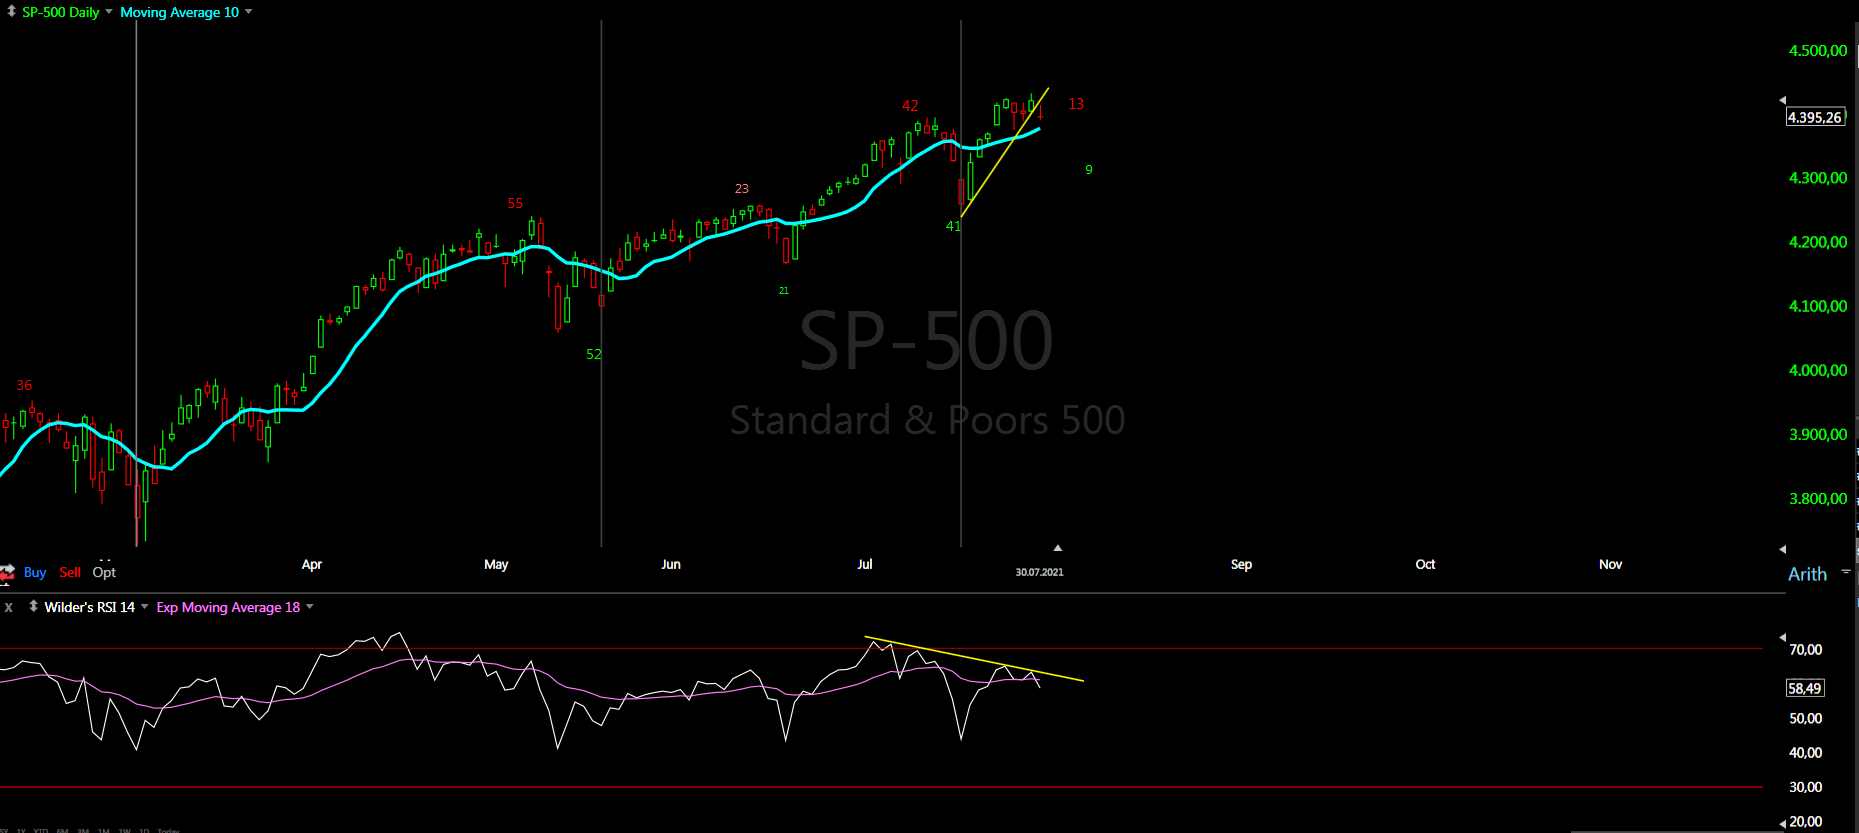
Short term - the two options shown a-b-c(green) as part of bigger pattern and now less likely a-b-c(white) from last week.

Intermediate term - from the March low we have one big zig-zag consisting of two zig-zags, which itself consist of zig-zags. You can call it W-X-Y, but there is no impulses. Last week I showed the a-b-c and this is if we see continuation. Many are counting this as ED, but I do not see the usual RSI signature, way too shallow second wave, missing on DJ,NYSE,NDX. More likely it is another double zig-zag from the March low for C/Y.

Long term - topping process running for months and maturing. Some kind of b-wave and c-wave will follow.

MARKET BREADTH INDICATORS
Market Breadth Indicators - like last week, resetting and I do not see signs for a strength or reversal.
McClellan Oscillator - resetting and around the zero line.
McClellan Summation Index - sell signal.
Weekly Stochastic of the Summation Index - sell signal.
Bullish Percentage - turned up, in the middle of the range.
Percent of Stocks above MA50 - in the middle of the range, does not show signs of strength.
Fear Indicator VIX - retracing, expect higher low.
Advance-Decline Issues - bounced up from oversold level, now in the middle of the range. For the first time cumultive A/D is showing signs of topping.
HURST CYCLES
Short term cycles - 20d high as expected and now heading lower into 20d low. With the current development it seems more likely the next 20d cycle to try to make higher high.

The long term count is not very clear, there is no visible significant low, the indices do not show consistent picture so we will be sure only in hindsight where the 18m low is. Two options correction since Mai is running and we have not seen the 18m low, the second reflecting what the broader market NYSE is doing.
This is the option that the next decline is the 18m low. The 40w cycle is already very long so you have to count one extra 10w cycle. What could be the "excuse" for that? - At the last low we had one missing 10w cycle and now it is appearing in the next 18m cycle. Time likes to adjust in the subsequent cycle if we see longer/shorter/missing cycle - this will not be a surprise.

Pasting the 18m low somewhere... what will be the "excuse" for this scenario? It is nothing new to see cycle making some insignificant low. Usually it means the next longer cycle is dominant making nice bell shape(see the weekly chart) - in this case this is the 4y cycle.
This is known problem with cycles and I was looking for a long time for an indicator showing significant low even if it is not visible on the price. The best one I have found is the McClellan Oscillator and the cycle count reflects NYSE and NYMO.

It does feel like another abc especially after Friday. The rubber band continues to stretch. Thanks for your work Krasi.
ReplyDeleteElliott trader keeps blocking my posts so I'll ask you - X wave today? Sure felt like one.
ReplyDeleteMore likely this b is completed and final c up(green) - see the second chart.
DeleteKrasi, is there weakness building up over the last few days? Feels like there will be some kind of a drop here.
ReplyDeleteNo, it looks like sideways correction for 20d low.
DeleteSo, it's bull flag?
ReplyDeleteWhat is your prediction for NDX Krasi after the impulse?
ReplyDeleteThe same like for all the indices - lower, test of the high, multi year decline.
DeleteIWM update?
ReplyDeletehttps://invst.ly/vnsnd
DeleteDJ you can count double zig-zag for c/C for Fibo perfection or we saw the top already - https://invst.ly/vnsor
ReplyDeleteThe proportions look much better if the top was in Mai and usually tops/bottoms are at important cycle high/low 18m high in Mai so this is more likely the pattern high.... the same like RUT posted above.
The bag holders right on schedule - https://www.zerohedge.com/markets/retail-stock-buying-july-blew-away-all-records-50-higher-previous-all-time-high
ReplyDeletestepping into a short SPX/ long vol position. same rules as my post C July 2 ( nb got out for breakeven having been well in the money mainly thanks to the long vol position)
ReplyDelete