Trading trigger - sell signal
Analysis - long term sell the rips, we have major top. Intermediate term - sideways pattern for a while.
P.S. - for a trade both analysis and trigger should point in the same direction.
TECHNICAL PICTURE and ELLIOTT WAVES
Short term - it looks like we have b/B from the June low. The alternate scenario is B(red) wave of lower degree and continuation lower.

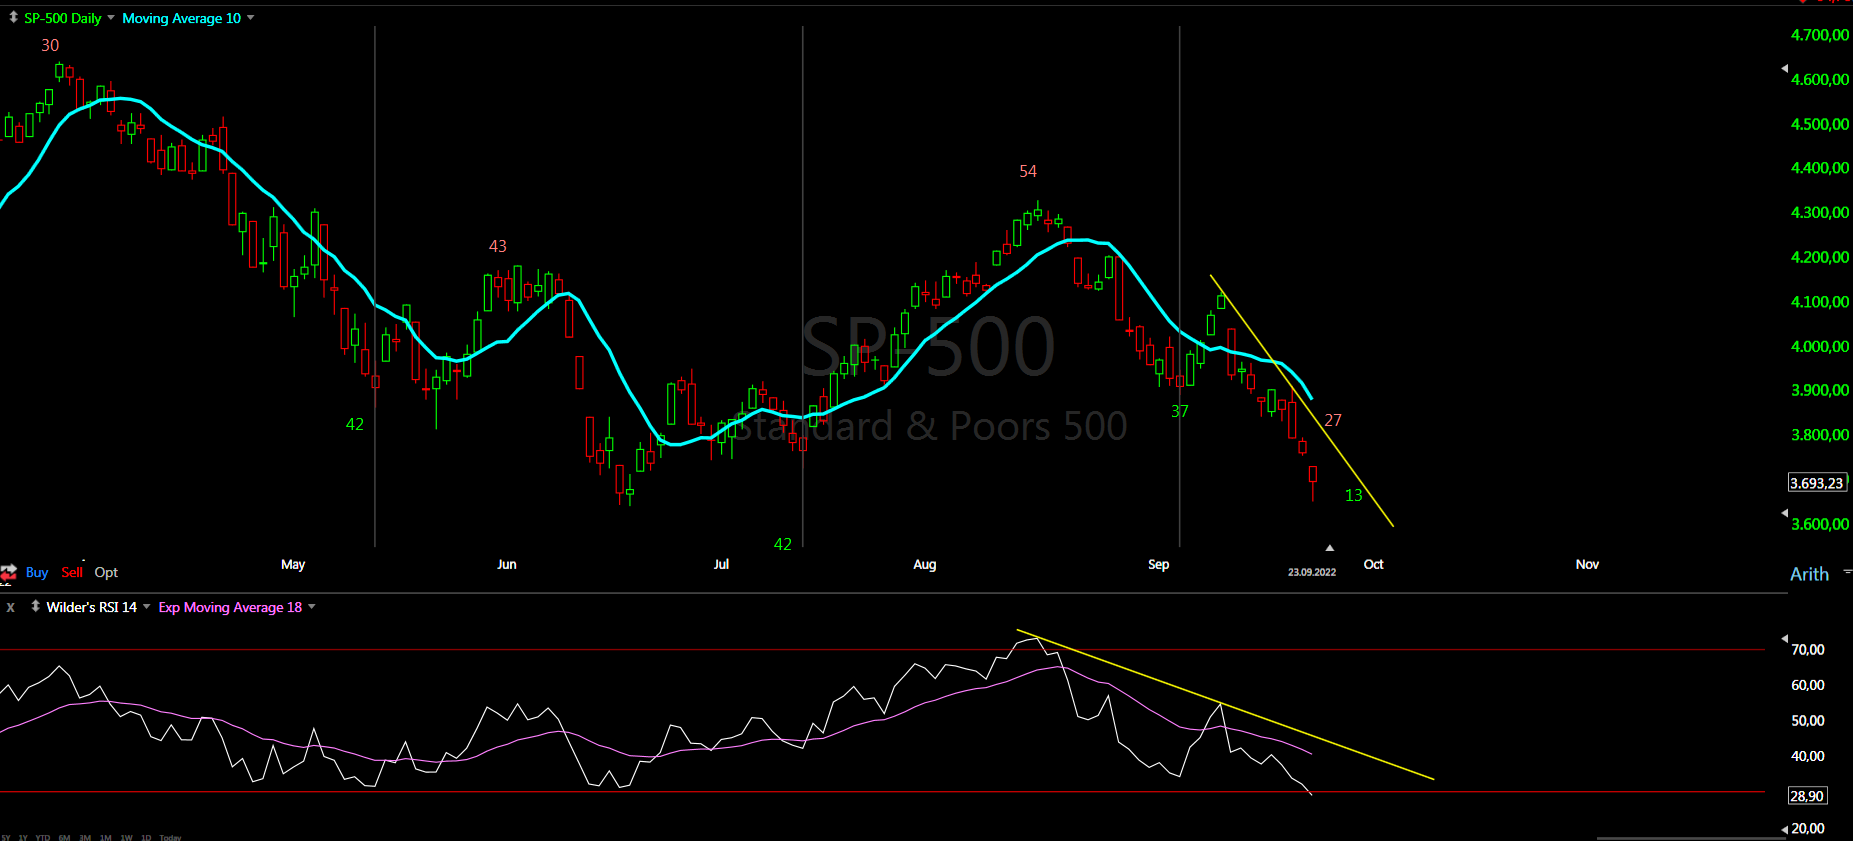
Intermediate term - the indices are in a sideways pattern, if I am wrong the decline will just continue.Looking the indicators like RSI, histogram it is more likely to have zig-zag than third wave.

Long term - if we are lucky this is b-wave, if not huge double zig-zag from the 2009 low was completed and it will get very ugly in the next years.

MARKET BREADTH INDICATORS
Market Breadth Indicators - most are oversold.
McClellan Oscillator - very oversold level.
McClellan Summation Index - sell signal.
Weekly Stochastic of the Summation Index - sell signal.
Bullish Percentage - very oversold level.
Percent of Stocks above MA50 - very oversold level.
Fear Indicator VIX - lower high comparedcwith the previous SP500 low.
Advance-Decline Issues - very oversold level.
HURST CYCLES
Short term cycles - probably a few days to complete 5w/20w cycle low. I think we have dominant 20w cycle and the cycles of lower degree 5w/10w can not be clearly pinpointed. It looks like 10w in the middle and two 5w cycles left and right.

Week 14 for the 20w cycle. RSI confirms we have decline into 20w low.

If there is a plunge in the short term, would you call it 18month low?
ReplyDeleteNo, just 20w low and the first leg lower of a bigger move lower.
DeleteFor a low of this magnitude you need a completed pattern - the logic is simple months in the opposite direction will follow, which means something has been completed.
DeleteThe earliest pattern to be completed is this one - https://invst.ly/z1bz0
Thank you for giving hope to those who still feel like shorting :-)
DeleteI have changed my mind it could be 18m low
DeleteKrasi, can you please take a long at USD-GBP (same as DXY?) and let me know what you think? Thank you..
ReplyDeleteToo late chasing it wait for a pullback
DeleteSorry I didn't mean long, I meant look. Do you think there is more upside left?
DeleteThe top should be in 2024 the cycles are showing pretty clear picture - https://invst.ly/z1gqh
DeleteWith this vertical move I guess pullback and one more high in the next two years.
I am thinking for a few days... this wave lower accelerated this week and it is too steep to be b-wave(from the August high) compared to the a-wave(from the June low).
ReplyDeleteThe alternate scenario b-wave of lower degree is the one which makes perfect sense from cycle and pattern perspective - https://invst.ly/z1gvp
The cycles run smooth highs and lows at pattern completion and we have nice alternation between the two zig-zags - the first with short and long leg lower and steep retracement, the second with two equal legs lower and sideways retracement... add to this great Fibo measurements for the zig-zags and not shown on the chart but this support level around 3200 is 62% retracement from the March.2020 low.
Or abcxabc
DeleteSo you mean b wave triangle into year end before a drop for the c? can this b wave go higher to 3900-60 instead and then lower again before even the year is over?
DeleteKrasi, is the projected uppermost extent of the reaction/triangle/"coil" depicted in your latest pattern perspective based on Fib retracements (38.2, 50?) above, time, ??? Just curious. Thanks for your inputs and thoughts.
ReplyDeleteShould have referred to the specific leg - b/C.
DeleteYes, it is Fibo retracement 38.2 and time is adjusted for the next 20w high and low.
DeleteThank you sir, and I continue to enjoy your blog. Your efforts are much appreciated.
DeleteYesterday 20 days low ?
ReplyDeleteI think today
DeleteWhy do you think now it is 18 month low ?, thanks
ReplyDeleteDAX highs and lows 6 40w cycles for 4y low early 2024 4 of them right on schedule, the highs right on schedule too - https://invst.ly/z2b8e
DeleteThis could be seen the best with NYSE from the US indices.
My Problem is the USD should pullback for a few months and this does not fit with decline for the indices - everything moves together.
I was expecting c/B or b, but my feeling tells me B has not started.
Yes but for that al least 1 month more, around 32 weeks for this 40 week cycle
DeleteAt least 2 weeks more
DeleteI have seen a hurst guys saying october 40w low like dax
DeleteI mean usd like dax
DeleteVertical drop in RSI, QQQ under 200WMA though SPX almost tested 200WMA and based on your analysis should go higher. What is your opinion Krasi, 20d low yesterday/today?
ReplyDeleteIt is time for the 20d low, but until it is confirmed is guessing... watching the 4h chart maybe final low today to complete second leg lower from the August high.
DeleteWhat would be a confirmation? A close above MA10?
DeleteFor the 20d cycle close above the previous day high and the opposite in the other direction - works almost perfect.
Deleteso, last tuesday could be 20d low
DeleteI think three shorter cycles for the 5w cycle - https://invst.ly/z381o
DeleteProbably higher until Friday next week.
Krasi, so if it doesn't "feel" like we are in leg B, would that imply (intermediate chart above) that we are instead in/completing leg e/A?
ReplyDeleteYes, it is possible better visible on NYSE - this is the third zig-zag lower.
DeleteMarket breadth indicators you have in the post seem to be saying we may be close to a bottom
ReplyDeleteYes, they are very oversold, this should be intermediate term low... the alternative is market collapses.
Deleteit is a crash simple, every indicators goes to it , no zig-zag
ReplyDeletethe federal reserve is in charge
DeleteIt was also in charge when stocks jumped from the July low.
Deletetrollmeter says buy
ReplyDeleteI concur. The 9/28/22 AAII Sentiment Survey - 20.0% Bullish, 19.2% Neutral, 60.8% Bearish.
Deleteit will be worse next week, Probably have never seen a bear market like this ever before.
Delete