Trading trigger - buy signal.
Analysis - at the top. Important turn lower next week.
P.S. - for a trade both analysis and trigger should point in the same direction.
TECHNICAL PICTURE and ELLIOTT WAVES
Short term - NDX double zig-zag with three different Fibo measurements coverging together.

Intermediate term - two zig-zags down and up... waiting for B-wave to be completed and C-wave for a flat should follow.

Long term - 4y cycle high the end of 2021, now a-b with c-wave lower in 2024.

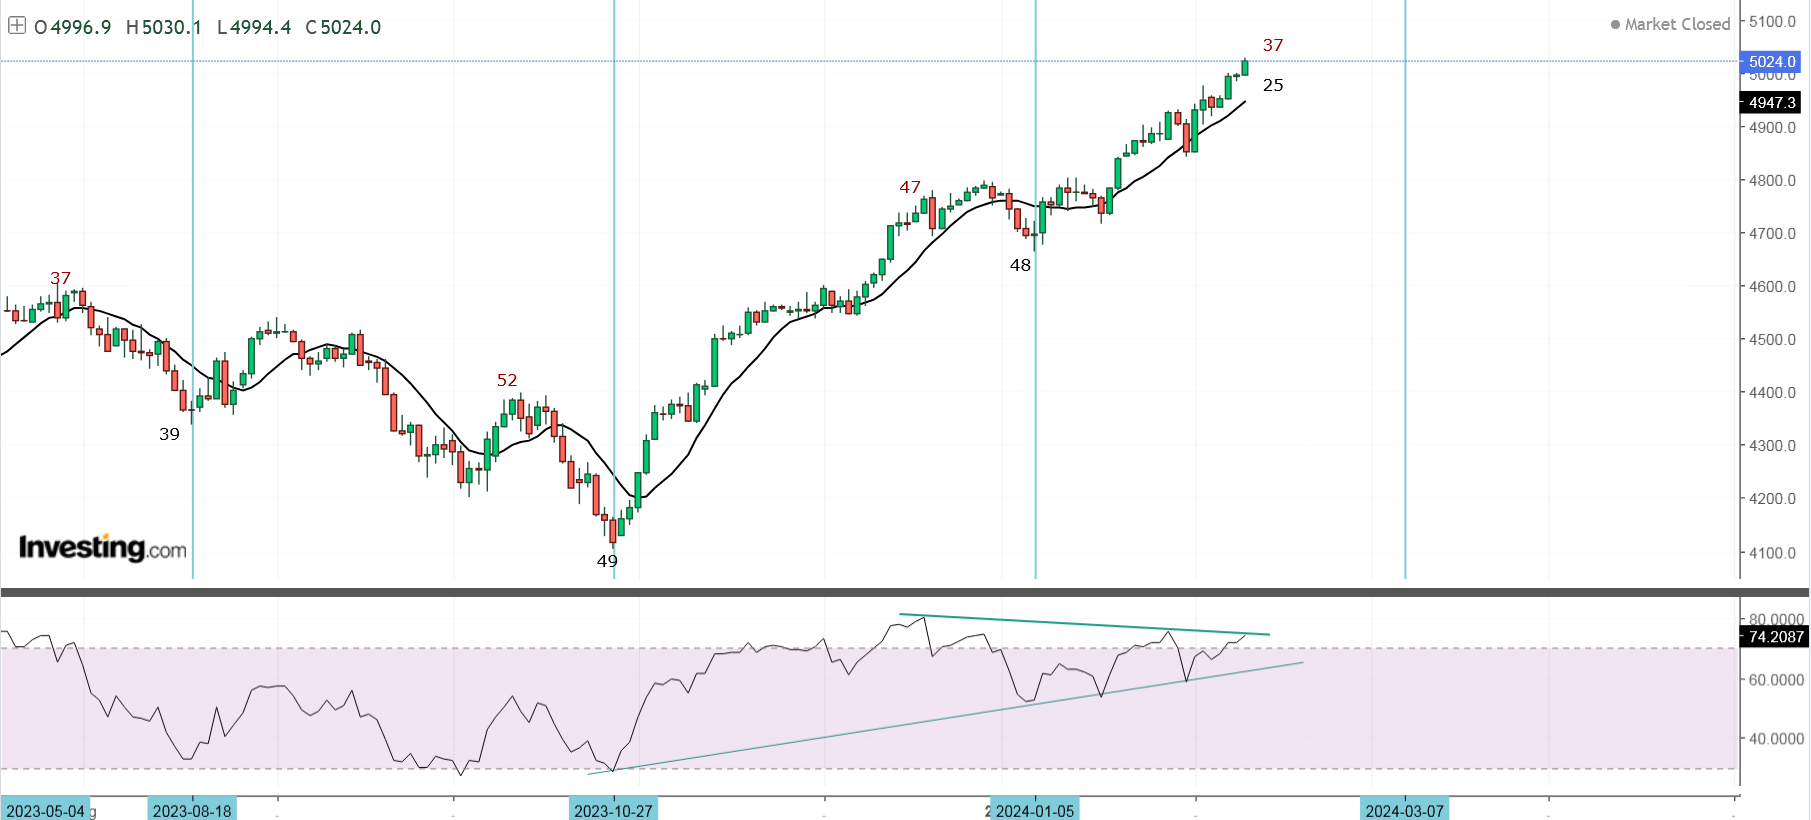
MARKET BREADTH INDICATORS
Market Breadth Indicators - very weak with divergences.
McClellan Oscillator - around zero with divergence.
McClellan Summation Index - sell signal.
Weekly Stochastic of the Summation Index - sell signal.
Bullish Percentage - declining, below 70.
Percent of Stocks above MA50 - declining, below 75.
Advance-Decline Issues - in the middle of the range with divergence.
Fear Indicator VIX - higher lows.
HURST CYCLES
Short term cycles - at 20d high which should be 5w/40w high.

We have 26 months from the previous high which means we have two 18m highs which means this is 18m high which means next is decline into 18m low. The highs and lows are aligned at pattern highs and lows, the sequence moves nicely - so this is the most likely count.
Anything else is make it fit... I will go this path twisting it to fit the theory only if this is proven wrong and it is not.
P.S. This is NDX with 2x13 months the same for the DAX is 2x15 months... I do not see how this is wrong.

Looking at NYA, DAX, I would say 18th January was 10w low.
ReplyDeleteSo end of January 20d high and 4-5 day more for 5w high
Even so we have 9 days already or another 1-2 days 4-5 is way too much.
Deletemaybe 12 january 5w high, 2 february 20d high, 5 february 5d low
Deletesome TA says this bull run will hit 5500 first before any drop. is that possible in any of your ED permutation?
ReplyDeleteThere is no ED I have deleted it and my TA says lower.
DeleteP.S. double divergence daily and awful market breadth but TA sees 5500 - another "expert" with master piece.
The short answer is NO this guy is trying his luck with ED measuring some Fibo levels - http://studyofcycles.blogspot.com/2024/02/s-5000.html
Deletethanks. in that case, we should see 5060 this week?
DeleteThe pattern I see is zig-zag and today the second leg reached the same size as the first leg at 5035... this is the only target I can give.
Deletewhat is the pattern we should look out for when the trend change? hourly chart lower low?
ReplyDeleteWatch for close below the open of the previous bar. I am using this on daily chart as a sign that the 20 day cycle turned lower, but it should work on different time frames.
DeleteTo be clear this is just a trigger not a reason to expect reversal.
looks like there is a daily lower low, correct?
ReplyDeleteNo, just bearish candle
DeleteKrasi, any thoughts on Japan market, it is bubbling higher like 2000 tech type market, is it out of sync with the western markets? or just the same story?
ReplyDeleteIt looks like double zig-zag from 2009 so not different...
Deletecheers
DeleteIf this is 5w low would synchronise all indices
ReplyDeleteRsi too low again on smaller time frames. I expect one more face ripper
ReplyDeleteMaybe one more 5w cycle... in March
DeleteSomething like this two legs with the same length in time - https://invst.ly/13gtzx
Deletehere this looks better https://www.tradingview.com/x/cdx8gwJK/
ReplyDeleteYes, Fibo looks good - https://invst.ly/13h717
DeleteKrasi, what happens now, 1 day down and now back to near ATH. what are we seeing here?
ReplyDeleteSee the comments above... and one more time - https://invst.ly/13htsd
Deletewhy is this one more time thing required? is it to look out for a test the ATH and fail with a flush down fast?
DeleteHow low are we talking about when it drops? Will it go below last years low or just above that?
ReplyDeleteThe first leg below last year low and the second leg below the 2022 low
DeleteLast Tuesday was 5w low?
ReplyDeleteMore likely this Tuesday
DeleteIs this expanding ending diagonal? The Fibo ratios are soo perfect.... - https://invst.ly/13hu4g
ReplyDeleteis this the end? or we still looking at 5050-5100? some hedge fund dude says this "The 10Yr yield is about to hit 4.25 -- it will likely not stop there. We reset the upside target higher -- say back to 4.28. This has a lot of significance to the outlook for ES and other index futures, which should tag along higher."
DeleteUsual late Friday rip higher into the close I would say.
DeleteKrasi, are you looking at mid next week for a potential top? Thx
DeleteWith day 5 today there should be 2-3 days more to complete the cycle high.
DeleteBTC topping soon? I shorted that mofo 🙏
ReplyDeleteI see this 4-5/c to complete second zig-zag - https://invst.ly/13ifqi
DeleteKrasi. with the CPI and PPI up, why is the market still holding on the the upside? dont make sense?
ReplyDeleteHave you heard of gambling? It doesn't make sense, people still do it. :)
DeleteIt is about greed and has nothing to do with economy.
Delete