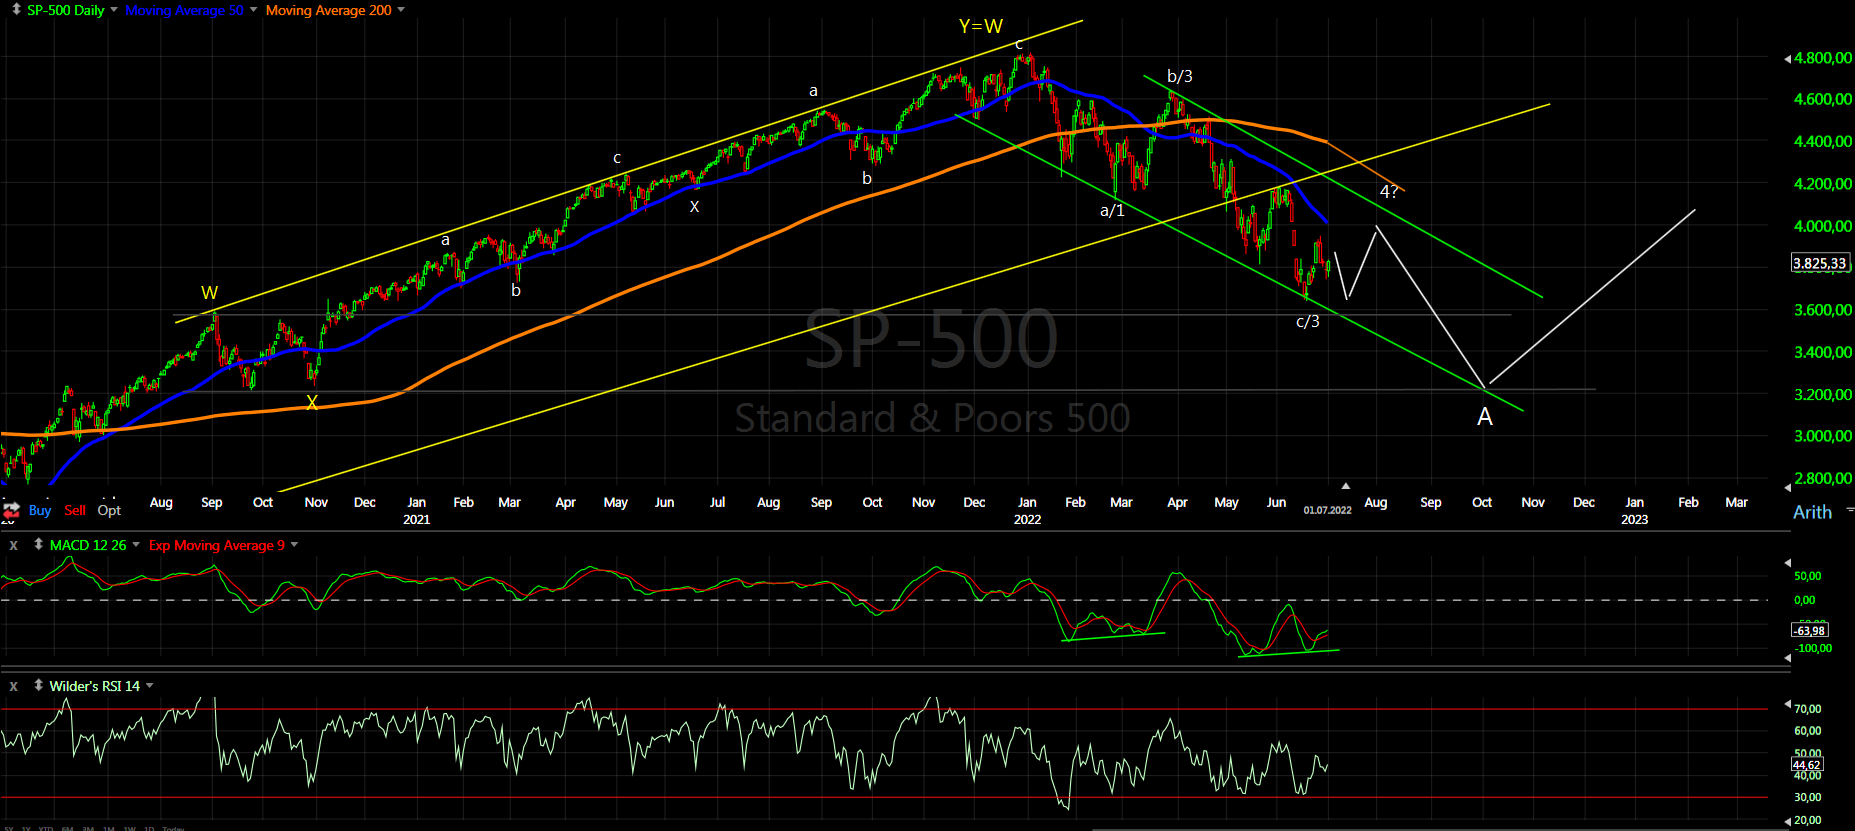
Jul 9, 2022

Weekly preview

Higher as expected... next week we should see a decline and 5w low. It looks like some b-wave running and with the next decline it should be completed.


TRADING
Trading trigger - buy sugnal, wait for the next low in a week if you want to buy.
Analysis - long term sell the rips, we have major top. Possible intermediate term low in June.

P.S. - for a trade both analysis and trigger should point in the same direction.
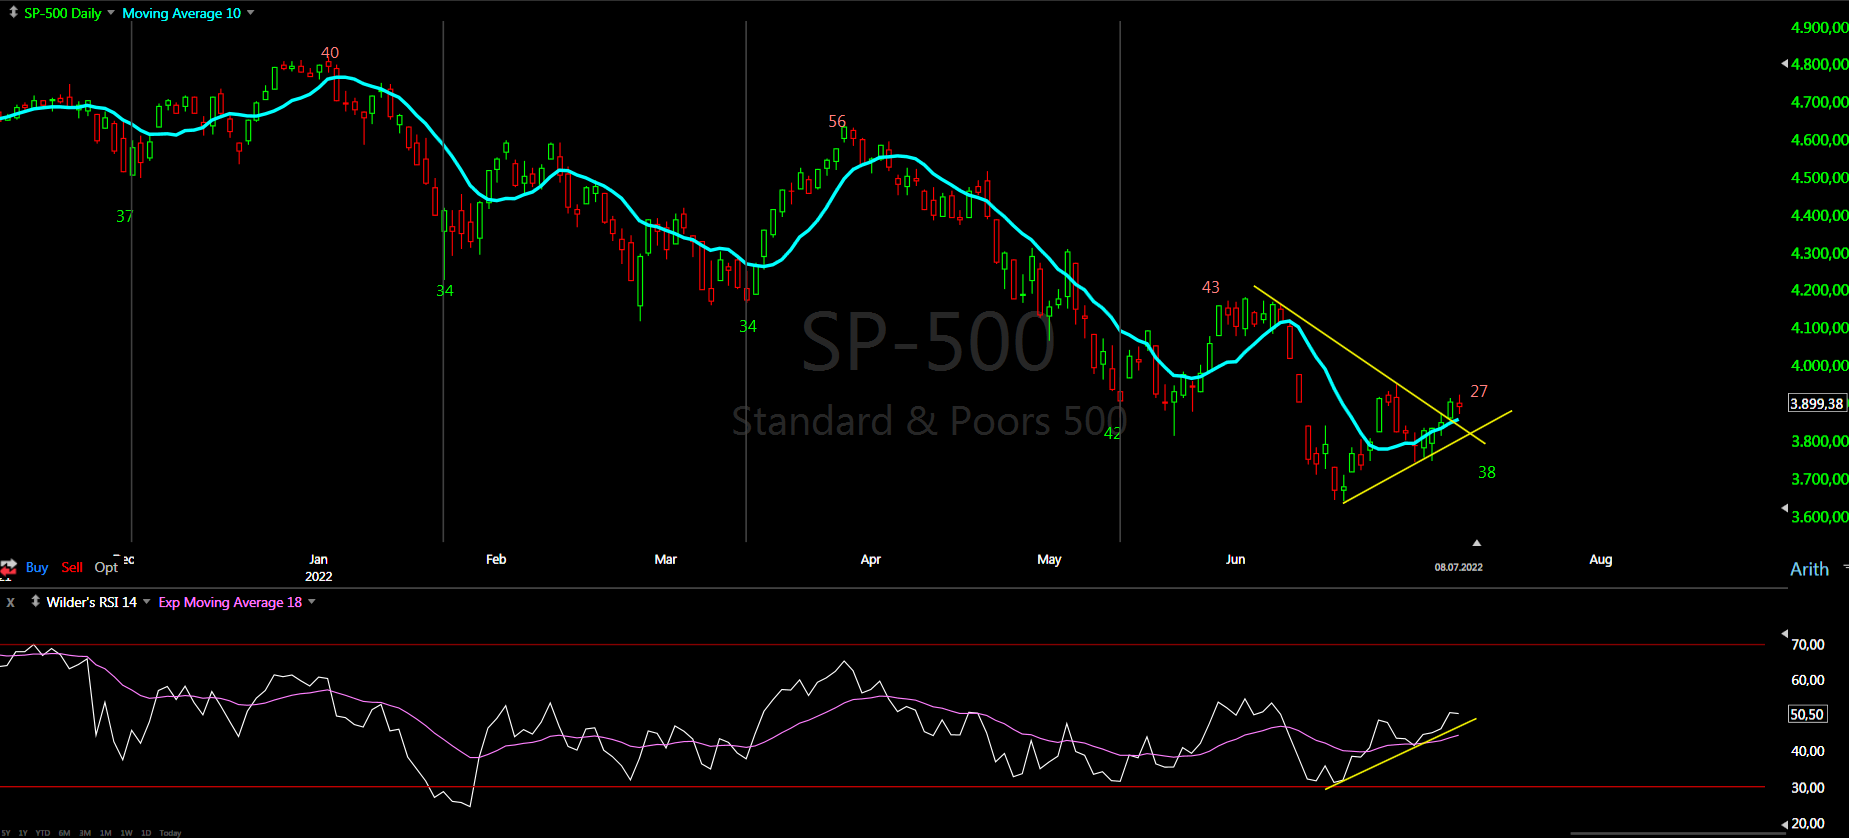

TECHNICAL PICTURE and ELLIOTT WAVES
Short term - the two cases shown... the green one still looks more likely.


Intermediate term - probably in b-wave of 4/x/B what ever it is.


Long term - We saw the high, if we are lucky this is b-wave, if not huge double zig-zag from the 2009 low was completed and it will get very ugly in the next years.


MARKET BREADTH INDICATORS
Market Breadth Indicators - are positive... but nothing special.
McClellan Oscillator - above zero.
McClellan Summation Index - buy signal.
Weekly Stochastic of the Summation Index - sell signal.
Bullish Percentage - turned higher.
Percent of Stocks above MA50 - turned higher.
Fear Indicator VIX - still in the range.
Advance-Decline Issues - in the middle of the range.


HURST CYCLES
Short term cycles - as expected higher for 20d high, next week we should see decline into 5w low.
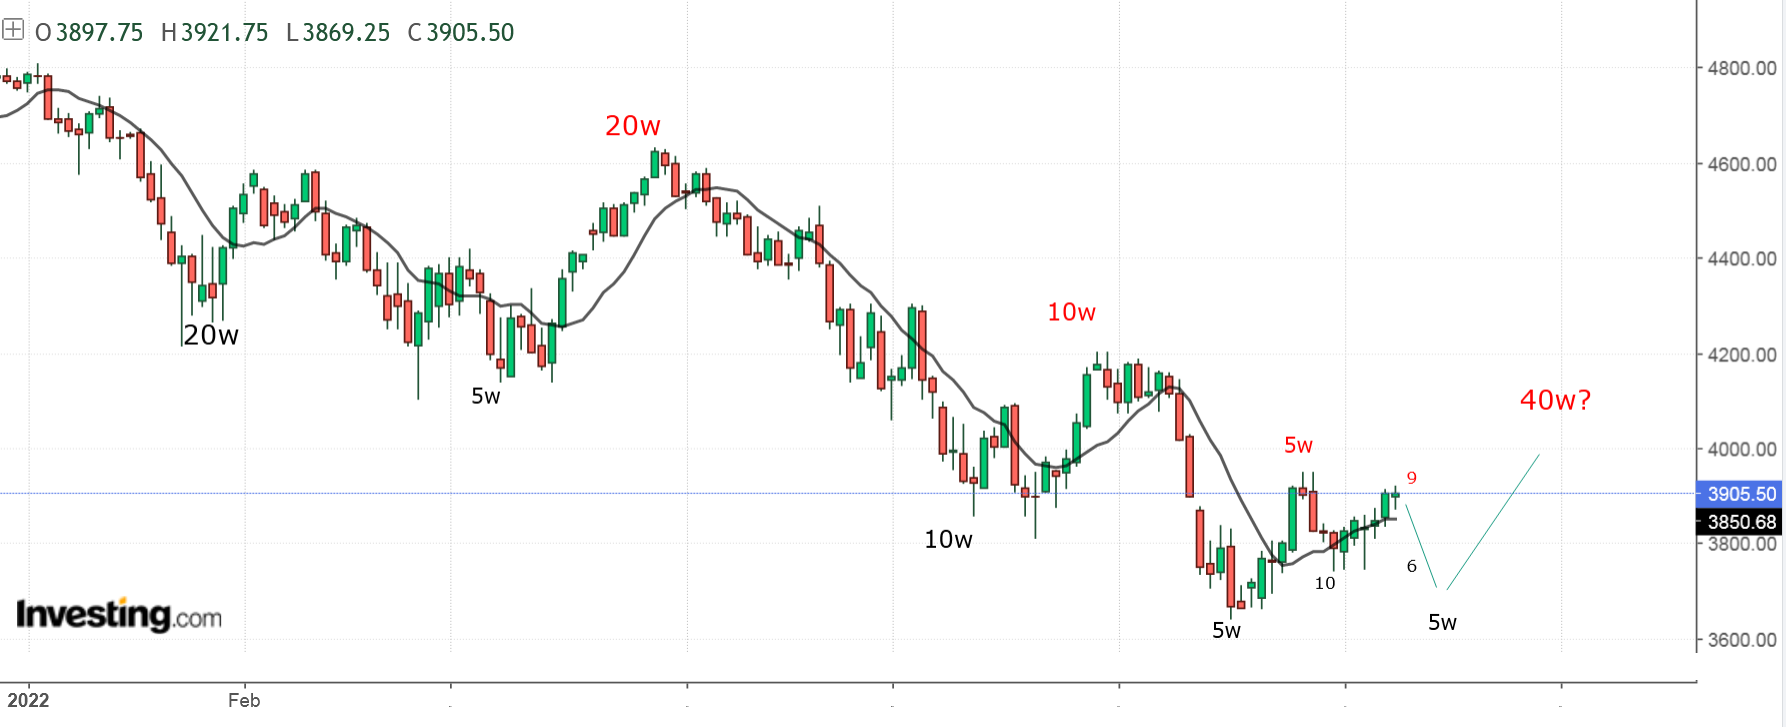

Week 27/33 for the 40w cycle high (from January/November). If you count from November around the end of July we should see the high. If you count from January the high should be around the end of August.

Jul 2, 2022

Weekly preview

Red week with deep retracement, but it does not feel like reversal it takes too long. I think it is some b-wave lasting until mid-July for 5w low.


TRADING
Trading trigger - another cross lower and higher, usualy this happens when sideways pattern is developing.
Analysis - long term sell the rips, we have major top. Possible intermediate term low in June.

P.S. - for a trade both analysis and trigger should point in the same direction.


TECHNICAL PICTURE and ELLIOTT WAVES
Short term - the two cases shown... the green one feels more likely.


Intermediate term - Probably in b-wave of 4/x/B what ever it is.


Long term - We saw the high, if we are lucky this is b-wave, if not huge double zig-zag from the 2009 low was completed and it will get very ugly in the next years.


MARKET BREADTH INDICATORS
Market Breadth Indicators - turned lower... too early to say for a new low or just b-wave.
McClellan Oscillator - around zero.
McClellan Summation Index - neutral.
Weekly Stochastic of the Summation Index - sell signal.
Bullish Percentage - turned lower.
Percent of Stocks above MA50 - turned lower.
Fear Indicator VIX - still in the range.
Advance-Decline Issues - in the middle of the range.


HURST CYCLES
Short term cycles - turn lower right on schedule for 5w high and now 20d low. Next we should see 20d high and 5w low around mid-July. The bullish case is shown with higher low.


Week 26/32 for the 40w cycle high (from January/November). One scenario with 40w lows early October and on schedule in May... just following the 16-18 weeks rhytm for the 20w cycle. It will be confirmed if we see some sideways pattern completed in August.