Trading trigger - another cross lower and higher, usualy this happens when sideways pattern is developing.
Analysis - long term sell the rips, we have major top. Possible intermediate term low in June.
P.S. - for a trade both analysis and trigger should point in the same direction.

TECHNICAL PICTURE and ELLIOTT WAVES
Short term - the two cases shown... the green one feels more likely.

Intermediate term - Probably in b-wave of 4/x/B what ever it is.
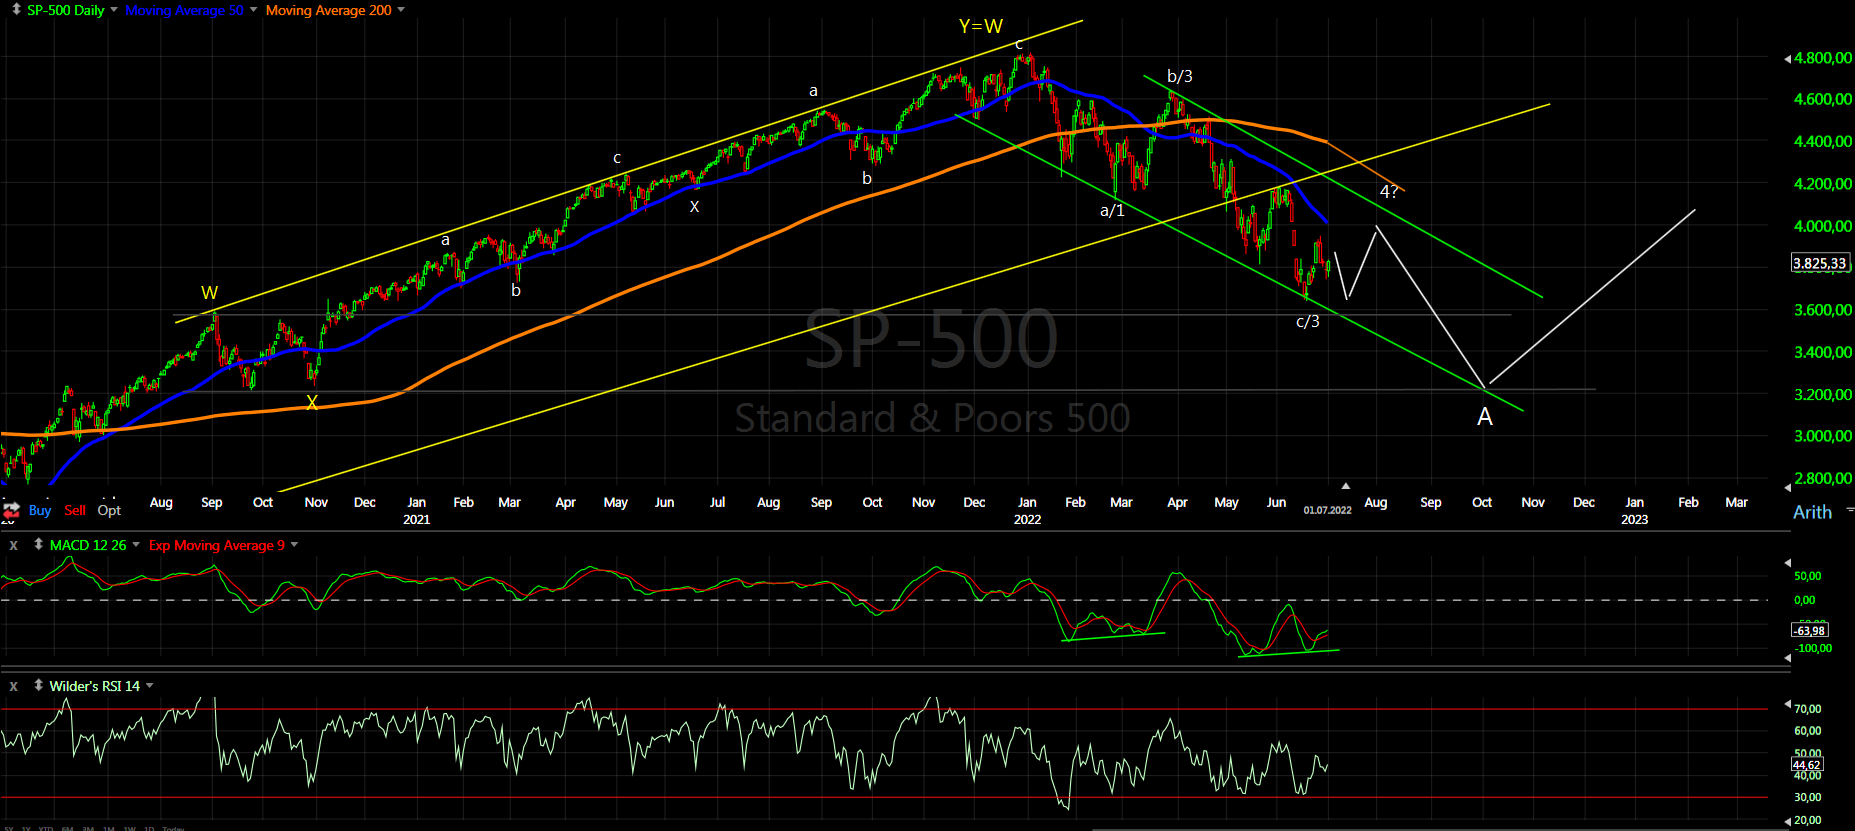
Long term - We saw the high, if we are lucky this is b-wave, if not huge double zig-zag from the 2009 low was completed and it will get very ugly in the next years.

MARKET BREADTH INDICATORS
Market Breadth Indicators - turned lower... too early to say for a new low or just b-wave.
McClellan Oscillator - around zero.
McClellan Summation Index - neutral.
Weekly Stochastic of the Summation Index - sell signal.
Bullish Percentage - turned lower.
Percent of Stocks above MA50 - turned lower.
Fear Indicator VIX - still in the range.
Advance-Decline Issues - in the middle of the range.
HURST CYCLES
Short term cycles - turn lower right on schedule for 5w high and now 20d low. Next we should see 20d high and 5w low around mid-July. The bullish case is shown with higher low.

Week 26/32 for the 40w cycle high (from January/November). One scenario with 40w lows early October and on schedule in May... just following the 16-18 weeks rhytm for the 20w cycle. It will be confirmed if we see some sideways pattern completed in August.

just going to long and hold my breath - thanks Krasi
ReplyDeleteHi Krasi, I always read this in all your updates and wonder what is your alt scenario here if its a zig-zag was indeed completed and how would that be counted for longer term cz even in this b-wave scenario, we should see quite lower as you are projecting to low 2000s? "Long term - We saw the high, if we are lucky this is b-wave, if not huge double zig-zag from the 2009 low was completed and it will get very ugly in the next years."
ReplyDeleteMany indices are showing clear corrective zig-zag, the same for sp500 - https://invst.ly/ygeco
DeleteJust because it is much more vertical I have seen all kinds of impulse counts... imho there is no such.
If this is the case we will see it way below 2200
Am I right in interpreting that Neely now thinks the bottom is in for the next 50 years?
ReplyDeleteNonsense
Deletelol next 50 years. What happens in next 50 days is anyone's guess at this point.
DeleteNeely's long-term interpretation differs from Krasi's in that as opposed to Krasi projecting a corrective bounce off ~3,000 on SPX and then back down below March 2020 low, Neely projects the 3,000 bounce to instead turn impulsive, and rise to new highs.
DeleteNeely changes his mind more than a day trader on Robinhood
ReplyDeleteKrasi, we are going to 4000 or more?
ReplyDeleteNot yet
DeleteYesterday was the top and we are going down for 5W?
ReplyDelete