Trading trigger - buy signal, close to the next high.
Analysis - long term sell the rips, we have major top. Intermediate term low in June and in the middle of corrective move up.
P.S. - for a trade both analysis and trigger should point in the same direction.

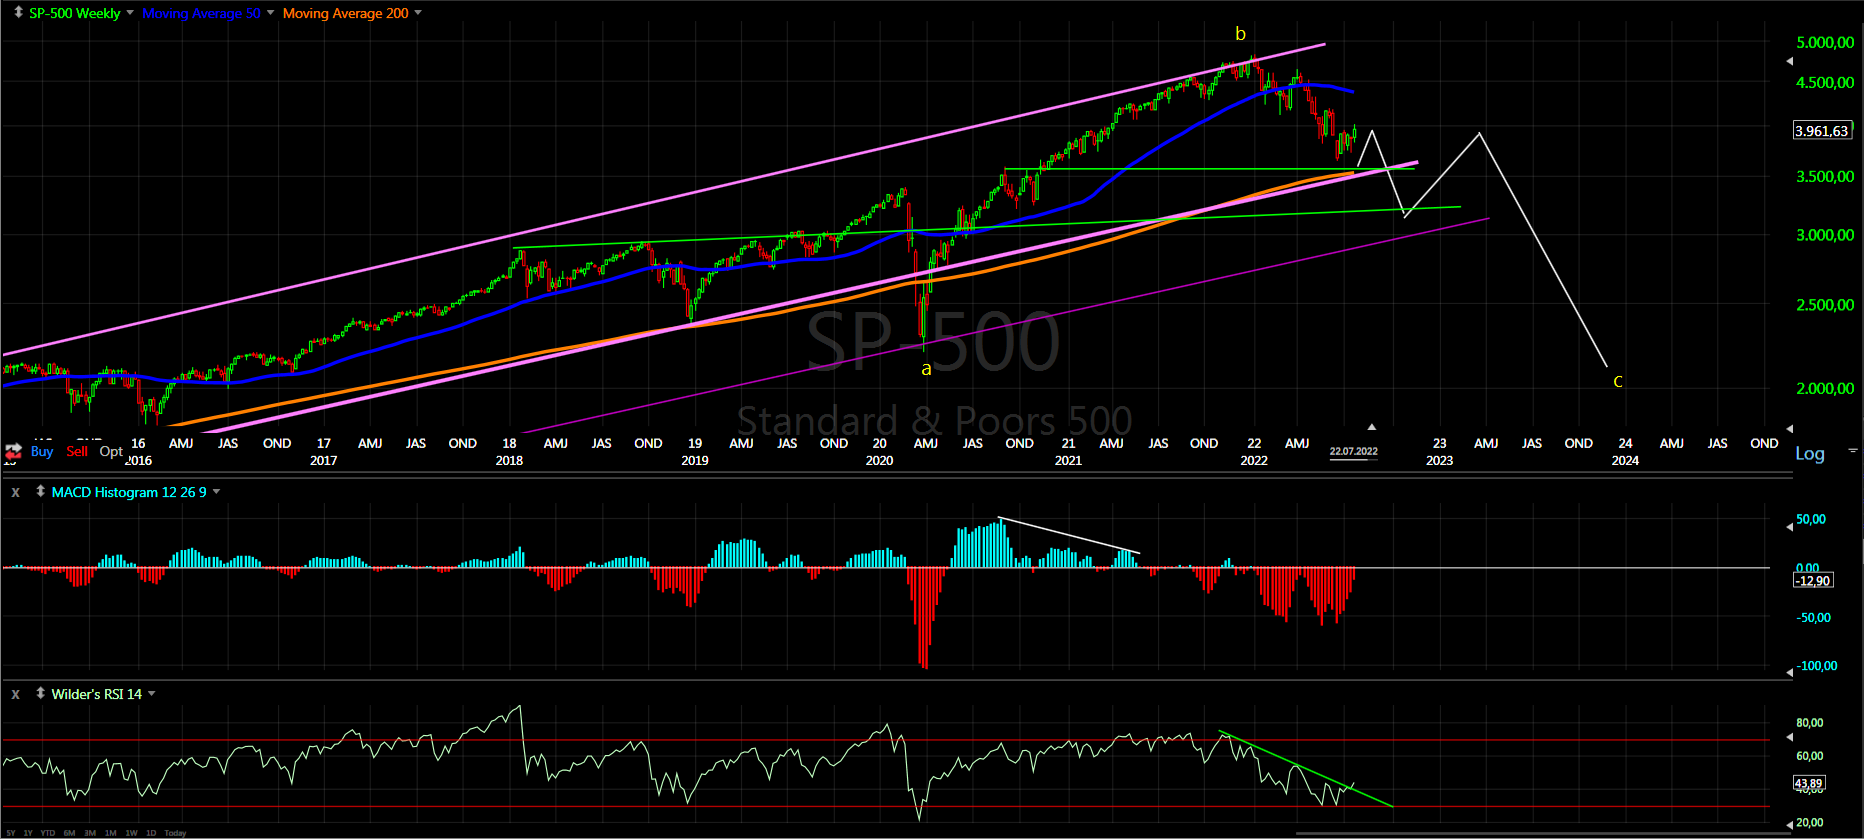
TECHNICAL PICTURE and ELLIOTT WAVES
Short term - a-b-c is completed or close to completition. In thext weeks we will see if it is part of a bigger pattern(green) or not(red).

Intermediate term - One zig-zag is completed so it could be a top or bigger corrective pattern is possible. In the case of bigger corrective pattern the top should have been in January and we have double zig-zag lower and now B-wave for the 40w high.

Long term - We saw the high, if we are lucky this is b-wave, if not huge double zig-zag from the 2009 low was completed and it will get very ugly in the next years. The histogram should move into positive teritory, which means higher for weeks.
MARKET BREADTH INDICATORS
Market Breadth Indicators - pointing higher, no signs of a high so far.
McClellan Oscillator - reached overbought level and turned lower.
McClellan Summation Index - buy signal.
Weekly Stochastic of the Summation Index - buy signal.
Bullish Percentage - in the middle of the range.
Percent of Stocks above MA50 - in the middle of the range.
Fear Indicator VIX - breaking lower from the range.
Advance-Decline Issues - moving higher.
HURST CYCLES
Short term cycles - close to 10w high, next should be decline until mid-August for 10w low.

Week 29/35 for the 40w cycle high (from January/November). If you count from November this should be the high. If you count from January it will take more time - the end of August or later.

Thanks Krasi.
ReplyDeleteNice work, that's a lot
ReplyDeleteThank you for your insight
ReplyDelete4100?
ReplyDelete4300
DeleteRead the weekly post.
DeleteSo we have to wait the end of August?
ReplyDeleteThe cycles are so so , sometimes they work but thé are highly interpretable, What is for sure is they and you know who » they are « , will never let the markets slip. It is in their capacity to control them. When they will loose control, ,iis when everything will go awry.IIn the meantime SPX is due for 4300 at the minimum.
ReplyDeleteChances are yesterday or today will be the high. AAPL and AMZN probably the catalyst.
ReplyDeleteAnd ps, Krasi said the high would be around FOMC in the first sentence off this post.
DeleteIt looks like 2020
ReplyDeleteMaybe we see the bottom?
ReplyDeleteKrasi, excellent. In line with your post Thursday could mark the high. Thanks for your work.
ReplyDeleteCrypto has broken out strong. Yields are dropping. SPX/NQ are looking strong. Not a single chart showing any bearishness.It just doesn't make sense to be bearish at this point in near term IMHO.
ReplyDeleteKrasi, I am eating to see your chart in a very extremely moment
ReplyDeletewhat are you eating, Lady ;)
DeleteShe eats sss
DeleteWaiting
ReplyDelete