Because EW and cycles do not work we saw completed zig-zag right on schedule and reversal. After 10 week high we should see a decline for several weeks and 18 month low.
Long term I have posted NDX/NYSE charts - I think the 4y high will be this year and it will play out like 2000/2007 with double top, now we are seeing the first high of it.
TRADING
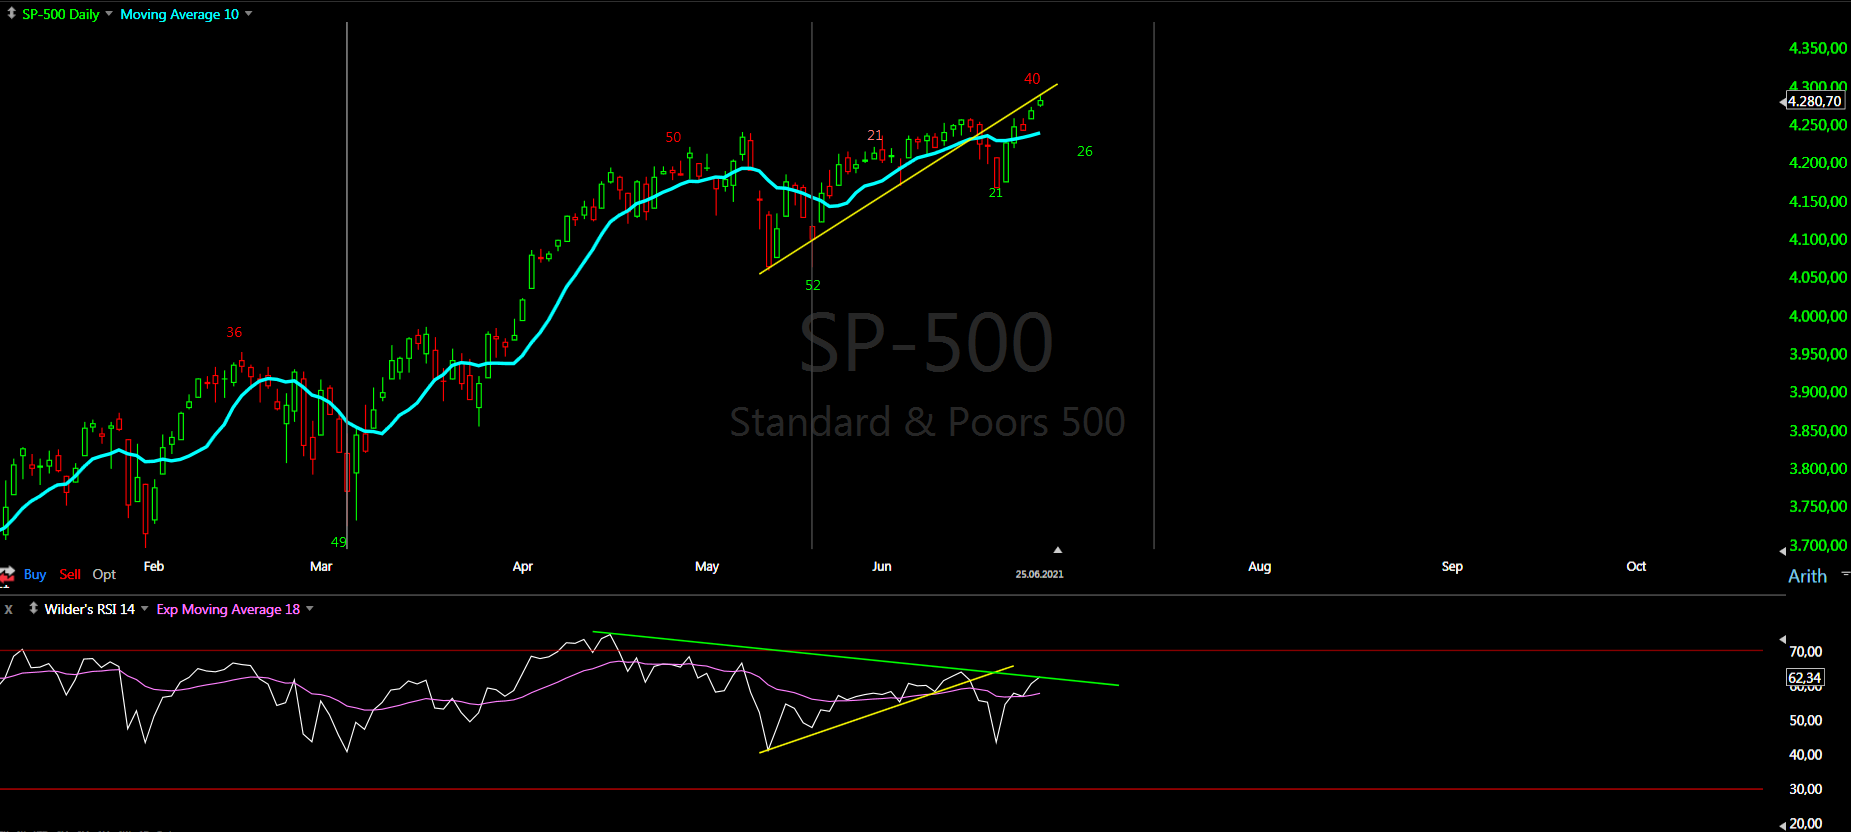
Trading trigger - sell. Price/RSI broke below the MA and the trend line after day 40(red) right on schedule.
Analysis - sell. We have turn lower into 18 month low.
P.S. - for a trade both analysis and trigger should point in the same direction.
TECHNICAL PICTURE and ELLIOTT WAVES
Short term - double zig-zag or according futures simple zig-zag with c-wave as ED was completed and now decline is running. So far is the typical zig-zag shape.
Intermediate term - from the March low we have one big zig-zag consisting of two zig-zags, which itself consist of zig-zags. You can call it W-X-Y, but there is no impulses.
Price is starting to brake below the trend line and MA50 and RSI on the verge of breaking the trend line from the March low.
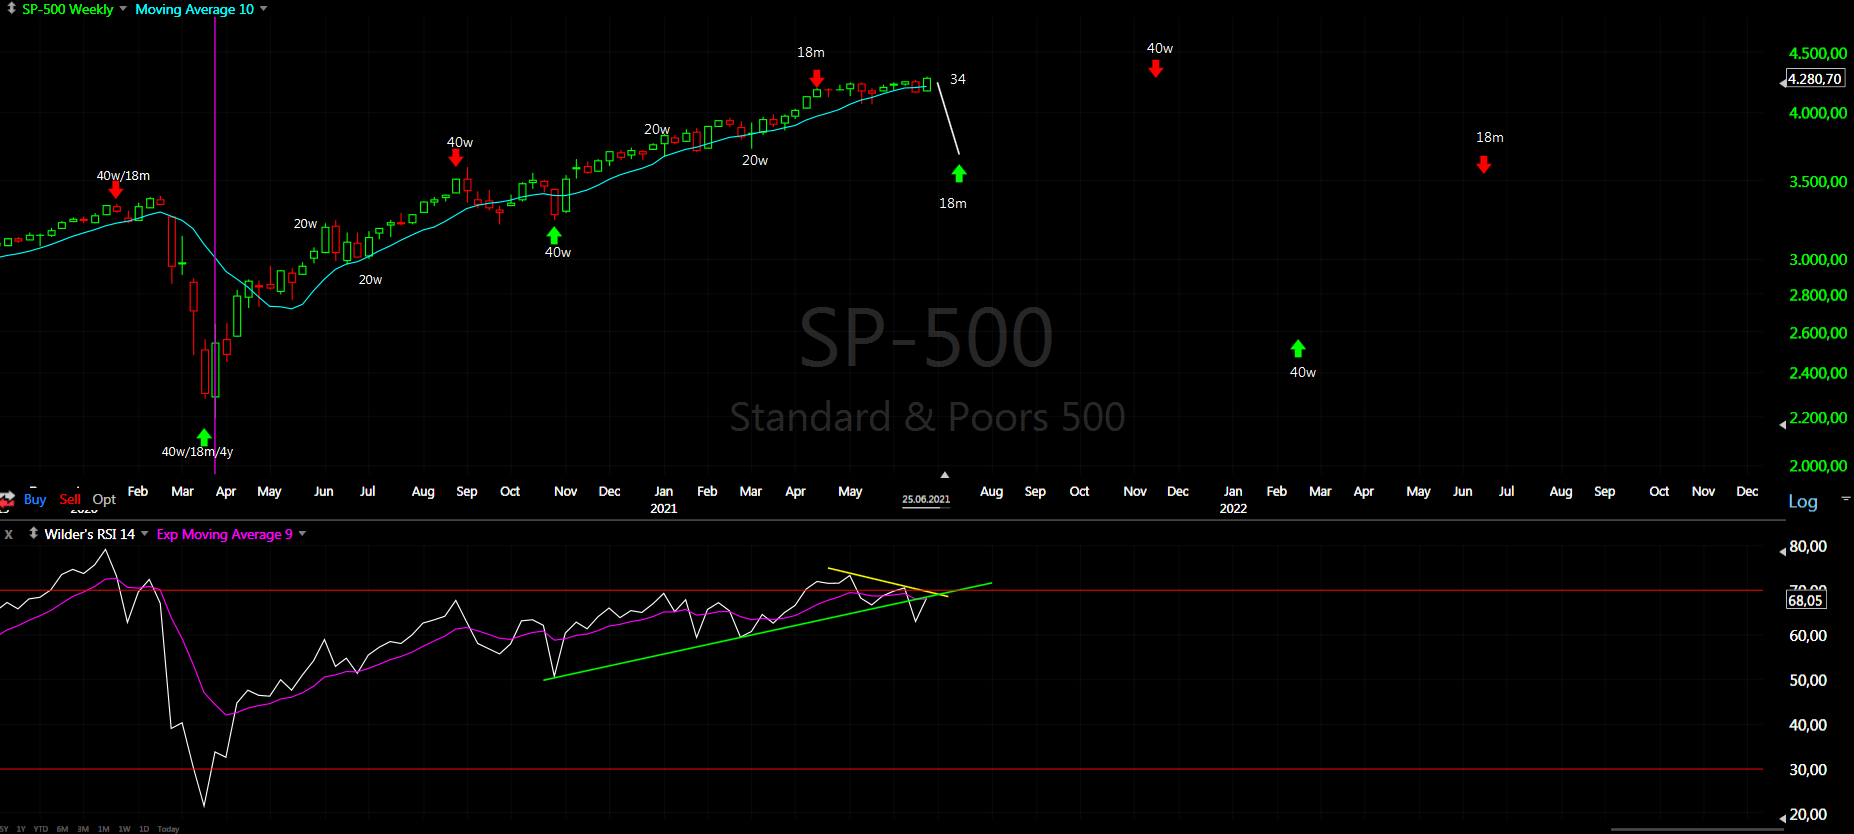
Long term - we should see correction for 4-5 weeks between 10%-15% for 18m cycle low. Pattern adjusted according to the cycle analysis.
MARKET BREADTH INDICATORS
Market Breadth Indicators - weak, turned lower and sell signals.
McClellan Oscillator - below zero.
McClellan Summation Index - sell signal.
Weekly Stochastic of the Summation Index - buy signal.
Bullish Percentage - sell signal, below 70.
Percent of Stocks above MA50 - very weak plunging lower.
Fear Indicator VIX - turned up after double bottom.
Advance-Decline Issues - heaing lower after another lower high.
HURST CYCLES
Short term cycles - it seems we have completed 10w high and next week we should see 5w low.
The longer term cycle the 18m cycle should take control and the highs should be lower highs - I expect pattern similar to the one shown on the chart.
Week 33 for the 40 week cycle. If you look at the RSI it is obviuos that the 20w cycle is turning lower.
In 2018 there were a lof of discussions if the high was in January or September. Now I think January.2018 is the more likely scenario. This means to expect the next 4y high this year. Given the right translated cycle and the next 18m low in a month expect a topping formation similar to 2000/2007. The so called M pattern - the next cycle making slightly higher high and failing.