We saw 5w low as expected now the final up probably 10w high then expect the final down leg for the 18m low. Obviously the b-wave of he correction has not been completed and it is more more complex matching the a-wave complexity.
P.S. I am on a holiday for three weeks so no updates the next three weeks. I will use the time to prepare long term update.
TRADING
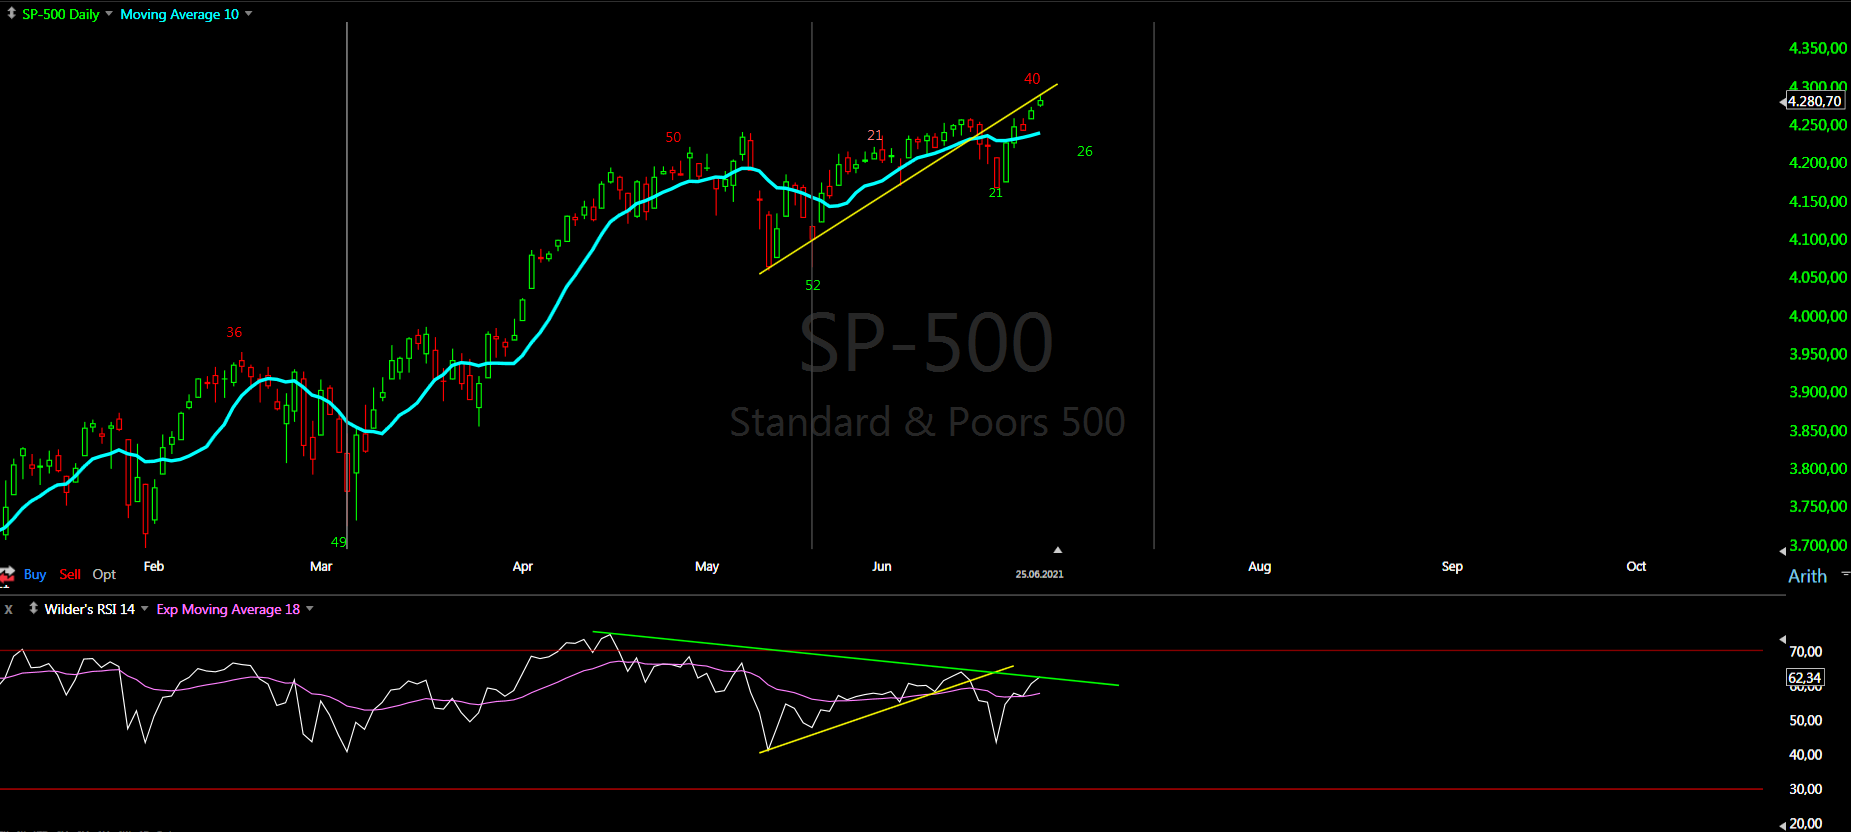
Trading trigger - buy. The analysis do not support it, probably price/RSI testing the broken trend line.
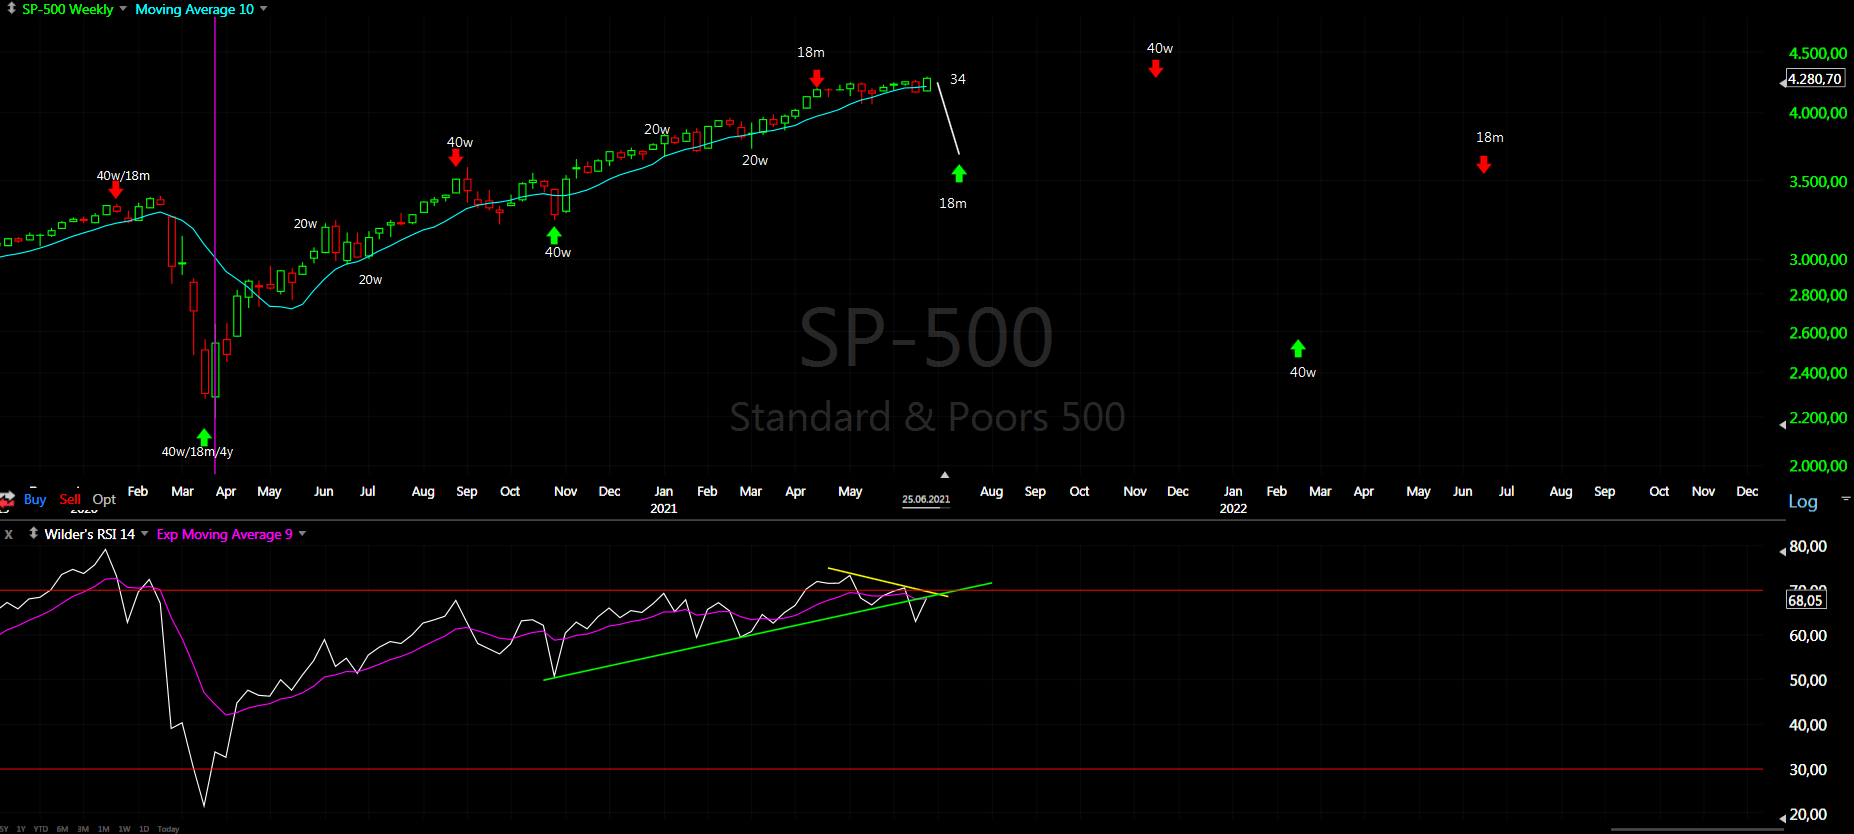
Analysis - sell. We have turn lower into 18 month low.
P.S. - for a trade both analysis and trigger should point in the same direction.
Short term - most likely the B-wave is bigger zig-zag. Currently we have c=0,618xa so waiting to see if this is the top or it will extend to c=a.
Intermediate term - from the March low we have one big zig-zag consisting of two zig-zags, which itself consist of zig-zags. You can call it W-X-Y, but there is no impulses.
Still in the b-wave and next is decline for the c-wave and 18m low.
Long term - we should see correction for 2-3 weeks between 10%-15% for 18m cycle low.
Market Breadth Indicators - do not show any reaction, still weak and sell signals.
- reseting close to the zero line.
- sell signal.
- turning lower.
- no reaction.
- retracing towards the middle of the range.
- more bottoming.
Short term cycles - I am watching this count. It fits with the pattern and explains the sharp rise.
There is no consistent picture - different indices have different short term highs. DAX mid-April, NDX mid- or end of April, DJ/NYSE early May. SPX is mix of all this and influenced heavily by big tech stocks. The two options left are - this is the 10w high or if you take the early May high one more 10d cycle.
Week 34 for the 40w cycle. RSI testing the broken trend line and MA.


The irony is, the market is likely to finally tank in the next 3 weeks while you're on vacation!
ReplyDeleteI was thinking the same. Never saw him taking holidays so this might be the charm. lol.
DeleteHappy holidays Krasi enjoy
ReplyDeleteFTSE 100 looks like it's about to crap big time
ReplyDeletehttps://www.tradingview.com/x/2pvPDj1a/
Deletehow did u get the direction of that?
DeleteI don't understand why breaking new highs is bearish. You write about cycles and the EWT and from reading your blog you went all in short. Maybe 2/3 short using triple leverage some time ago. That was likely many hundred points ago. Why not teach us real time on how to effectively trade your analysis by posting in real time when you short and when you cover? I can't imagine you made any money unless you mysteriously got out and went long. If you read many professional traders books, they suggest never shorting until the market actually breaks the 200 day moving average. Until then, you should always trade in the direction of the bigger trend which is up.
ReplyDeleteI don't think anyone is saying new highs are bearish by itself, but every major correction or crash happened right after a new high. The theory Krasi uses only seeks to identify possible major tops that are only actionable upon certain conditions.
DeleteSimple indicators, market breadth, cycles.
DeleteThe news that will justify the sell off when it comes is already in the market - Inflation concerns. Buyers will just step aside and sellers will take over for a few weeks and reset the market from extreme overbought position
ReplyDeleteAnyone who has been in the market long enough will know that you don't need shock events to create a sell off just the reason behind it identifiable during the sell off and for it to create sufficient fear to remove buyers for a period of time. Like some one said the other day, everyone is on the same side of the boat at present so it wont take much to start the selloff
At the previous top I left all this crap comments on purpose(of course the lesson has not been learned) and said the next time they will be deleted.
ReplyDeleteHere we are at the next top and the same crap all over again. I am talking about 4 year cycle high and topping/pattern taking months and have to listen intraday/daily bullshit "analysis" mainly from one troll. The trolls and the sheeple will never learn and I do not plan to listen their crap for months.
For the last time - if you have analysis posted. Any other comments will be deleted, all snp comments will be deleted.
There will be no discussions. I have stopped explaining at the previous top.
DeleteRead the disclaimer at the bottom of the page.
If some one blames me for his decisions - LEAVE THIS PAGE DO NOT COME BACK.
Krasi can we know the exact day to complete 4 year cycle?
ReplyDeleteNo, I have explained about cycles and highs.
DeleteLooking to start a short SPX/ long UVXY later today/ tomorrow. SPX P&F target 4310, other targets I use 4320-4340, time target also almost reached. As usual ( see my previous posts) one third position to start, a further third if 2 days in a row close lower than 4 days previously, a further third if MACD breaks below its signal line. Stop 1% above initial position price then at phase 2 lowered to initial position price, then gradually adjust downwards as ( hopefully ) price falls
ReplyDeleteNB also fits with Krasis c=a
ReplyDeleteKrasi, I have read your blog for apprx. a year now. You have strong belief and convictions in your work. Frankly, you come across a bit too didactic. Not even the best technicians or their programs are 100% correct. Consider tempering your prognostications with a little humility. It can go a long way. Enjoy your break and good luck.
ReplyDeleteBTW, the low of 2100 (?). There's a ton of money on the sidelines and people have already began taking profits. Maybe a correction of 10-15% at most, but "I could be wrong".
enjoy your holiday
ReplyDeleteIs it possible 21 june was 18 month low?
ReplyDeleteAt intermediate term lows and reversal market breadth indicators shoot up vertically.
DeleteFor the current rally they are showing zero reaction... even no buy signals and it is lasting two weeks already.
So I doubt it, with high probability the indices are still in the middle of a correction... tech stocks masking the weakness.
Fibonacci measurements convergence - https://invst.ly/vccig
ReplyDeleteI don't think anyone cares anymore, Krasi!
ReplyDeleteWe finally got a nasty looking reversal candle in NDX. Let's see what comes from it.
ReplyDeleteearthquakes in California, if it's just the beginning of something larger, it would be a horrible black swan event.
ReplyDeleteYesterday looks like 20d low now pause for a day or two and final two weeks lower.
ReplyDeleteThanks Krasi .
ReplyDeleteAll recent corrections have been 185 points or less , which coincides with 4165 support . That's going to be MOB .
Nasdaq corrections have been a minimum of 1000 pnts , up to 1600 points - so that gives some idea of minimums over the next fortnight . That would suggest bond yields are going up again , so short treasuries looks interesting too given the recent rally .
There is a turn due around 19-23 July - fits well with your thoughts .
Enjoy your hols
Maybe february 2021 was 40w low instead october 2020?
ReplyDeleteIt is way too long almost one year.
DeleteThis makes sense only if the 4y cycle low was in June.2020 as expected and there is no missing 10 week cycle.... I do not know how to justify such higher low.
Maybe a 40 week cycle of 46 weeks
DeleteThis will be statistical anomaly I have not seen such long cycle usually they are shorter 32-36 weeks. The other two options look more likely - a low in June or we have not seen the 18m low.
DeleteA lot of discussions about cycle with length 3,5 years - https://forum.hurstcycles.com/
ReplyDeleteThis is what I am showing on the weekly chart and explained a few times - since 2000 we have cycle highs every 3,5 years like a clock and we are close to the next one.
About the lows - studying historical SPX/DJ chart I can say often 18 year cycle counts better like 5x3,5 cycles.
You can stick to price lows and start from 2009 counting 5x3,5 cycles currently in the fourth one from 2020 with major low 2027-2028.
Or you can stick to Hurst theory and count like this - 2002-2011-2020-2029
What are the corresponding highs for 3,5 cycles starting 2000 for which you are saying the next one is close?
ReplyDeleteNot very difficult to spot them - https://invst.ly/vgq55
DeleteThank you! Looking forward to your long term update. For the short term, are you expecting 18month low over the next few days?
DeleteYes, this is the model which fits the best - market breath has not signaled any significant low.
DeleteNDX possible impulse - https://invst.ly/vgvpx
ReplyDelete