Intermediate term view - topping process running... after that we should see 8%-10% correction.
Trading system signal (swing trading) - Direction UP: | Last entry signal: at SP500=1514 on 01.03.2013 | Stop at: 1509.
The trading system signals - there was short signal at 1510 and SP500 moved lower. The stop was moved at break even(says the system) but in this particular case resistance was 5 points higher. It is a personal decision if you want to risk 5 points or not. At the end the system was right.
Now we have long signal... I do not think that another intermediate move higher has begun but is possible to see higher highs. As I wrote wait for a pullback and on Friday SP500 opened lower just to see a strong bar on the hourly chart closing back above EMA50 and 1514. So the next entry was at 1514 and the stop is at 1509 which is bellow support 1514, bellow the last minor low 1510 and 2-3 points bellow EMA50(currently at 1512).
P.S. I will post an extra page with the results and try to post the signal asap.
What happened - I have wrote to expect choppy pullback and another move higher and this whole action this week is exactly what is happening. The short term is difficult to predict. I could not nail all the short term moves but that is difficult and usually I do not try. It is an exception that I have posted so often. So the main idea stays the same.
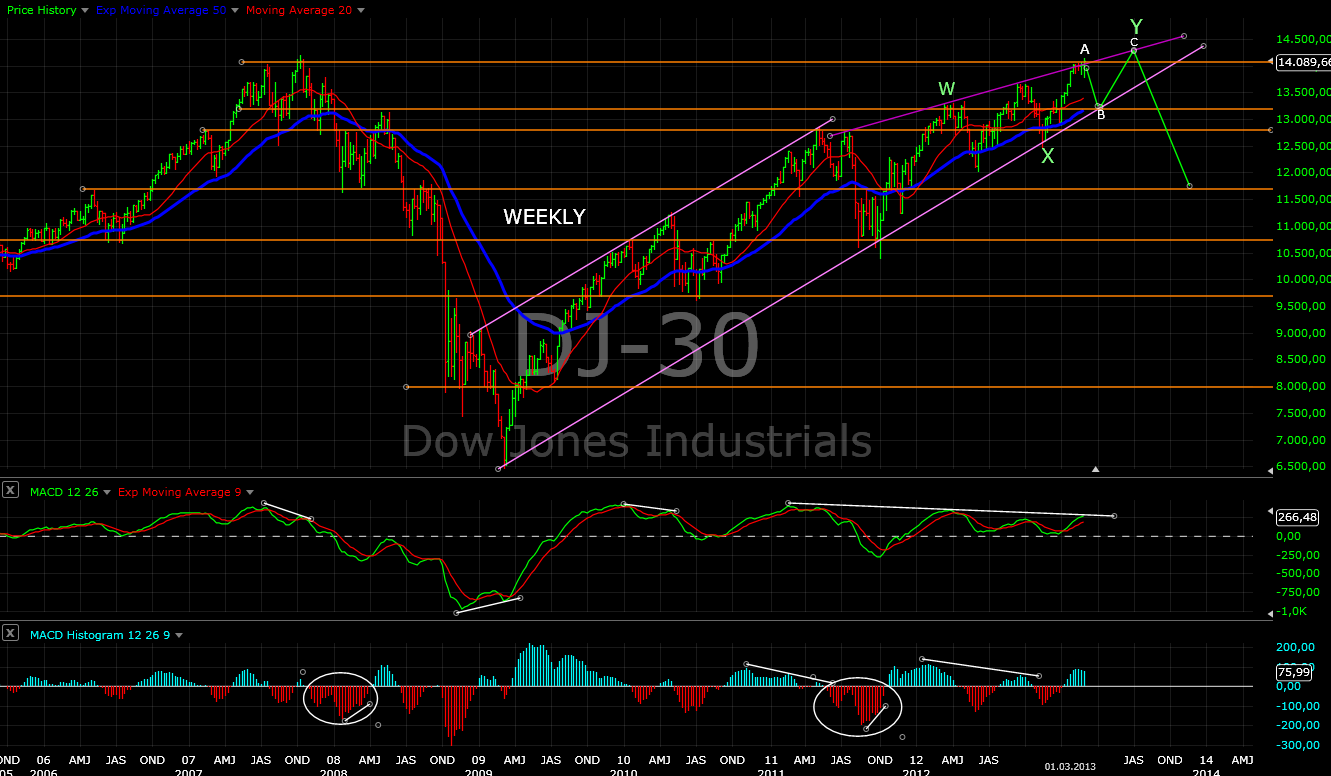
What to expect...??? First the bigger picture - take a step back forget about all crazy up and down moves and look at the weekly chart. What do we have? - a rally since November and one month sideway action. Such sideway action sets the stage for the next big move up or down. It could be a pause before moving higher or we have topping action like in Mar-Apr and Sep-Oct 2012. We saw strong moves with brief pause in the middle after significant lows after significant corrections - 2009 bear market low, July 2010 17%, October 2011 20% that is not the case now. The indexes are few points away from new all time highs, bumping against very long term resistance and the wedge trend line, very bullish sentiment, market breadth indicators hitting overbought levels and reversing, TD Sequential weekly finished 13 combo and countdown, week 15 of the last 20 week cycle before 18 month low... I will bet on a correction.
The shorter term is the difficult part. I do not know how exactly and when the correction will start. There is several scenarios - first the pullback A-B-C is over and move higher has begun. Then probably we will see marginal new highs to suck in more traders on the wrong side and kill more bears before the correction starts. The second scenario the pullback is not over and we will see one more leg down followed by another move higher making probably lower high - more up and down confusing the traders totally so they give up and miss the initial part of the move which is usually the most profitable. And third scenario the pullback is over and the reaction up is over or soon it will be over... who knows.
Trading plan - simple I will follow the signals of my system. Now it says higher - marginal new high, all time highs, up to the moon who cares a gain is a gain:) If the indexes reverse on Monday and move bellow 1510 go short that is all.
TECHNICAL PICTURE
Short term - until the price stays above 1514 support and EMA50 the short term direction stays up. The open on Monday will give us more information.
The first scenario pullback is over and move higher has begun(green). One leg up 40 points, on Friday corrective move and than one more leg up (1501+40) with target 1540-1545 around the trend line.
The second scenario the pullback is not over - than Y (red) should follow with target 1470-1480 support and Fibo retracement level.

- Triple cross(EMA10 and EMA20 crossing EMA50) - EMA10 and EMA20 are back above EMA50 which favors the idea that the pullback is over and the short term direction is up.
Intermediate term - the last two candles are bearish - shooting star and hanging man which favors the scenario that the pullback is not over.

- Trend direction EMA50/MACD - the price is testing EMA50 and MACD is moving lower, as I have said we are in a pullback currently. The price is still above EMA50 and MACD above zero so intermediate term trend is still up. If my forecast for a correction is right... it remains to be seen.
- Momentum Histogram/RSI - turned up supporting this short term move higher.
Long term - no change, expecting this wave to finish and correction for several weeks.
- Trend direction EMA50/MACD - MACD above the zero line and price above EMA50, the long term trend is UP. Triple divergence on MACD watch this veeeery carefully.
- Momentum Histogram/RSI - momentum is turning lower which supports the idea for an intermediate term move lower.
MARKET BREADTH INDICATORS
The Market Breadth Indicators - all trend indicators with sell signals. The short term indicators McClellan Oscillator and Percent of Stocks above MA50 confirming move on the upside.
McClellan Oscillator - made two lows outside its BB and is on his way above zero. It looks more like that the pullback is over.
McClellan Summation Index - sell signal.
Weekly Stochastic of the Summation Index - sell signal.
Bullish Percentage - sell signal.
Percent of Stocks above MA50 - testing the 75 level. Probably will make divergence on its way up.
Fear Indicator VXO - I expect to see higher low even if we see the indexes making new highs.
Issues Advancing - is showing weakness making lower highs, fewer issues are moving higher.
Issues Declining - is making higher lows, which means more and more issues are declining.
HURST CYCLES
Does not help us at all to decide if the pullback is over or not. It might have been short cycle 14 days(pullback is over) or one last final move lower is missing and we will see 20 day cycle with normal length.

The cycle is mature at week 15 of 20 week cycle. 20 week and 18 month cycle top should bring decent correction but the fact that they are topping late in the cycle means to expect more upside after that.

Tom Demark SEQUENTIAL AND COUNTDOWN - this technique spots areas of exhaustion.
Nothing worth showing.... daily chart is a mess up and down, weekly the same story - TD Sequential finished several weeks ago.
UPDATE
Shame on me:((( there is a lot of to show.... Today 05.03 on the daily there is another 13 Countdown finished and on the weekly chart there is setup 9 finished...
krasi, still maintaining your opinion that TZA will reach 14 this month?
ReplyDeleteIf I am right about the correction we should see 50% retracement. For RUS2000 this is ~850 and for TZA 14,5. It looks more like the first half of April for the end of the correction.
ReplyDeleteKrasi, if the SPX does pop to 1540-1545 this week, under the scenario that we decline into early April, would that be the final test of the highs and the decline would begin in earnest? Or do you think the decline would be bought and we would then retest 1540-45 again after bouncing off of the 1475 support level?
ReplyDeleteThanks!
I think this move up now should be the final one, but I will feel more comfortable when I see the SP500 moving above 1525 killing this way the idea for pending Y wave lower.
DeleteOn the way lower there will be probably bounce off the 1475 level which should make lower high.