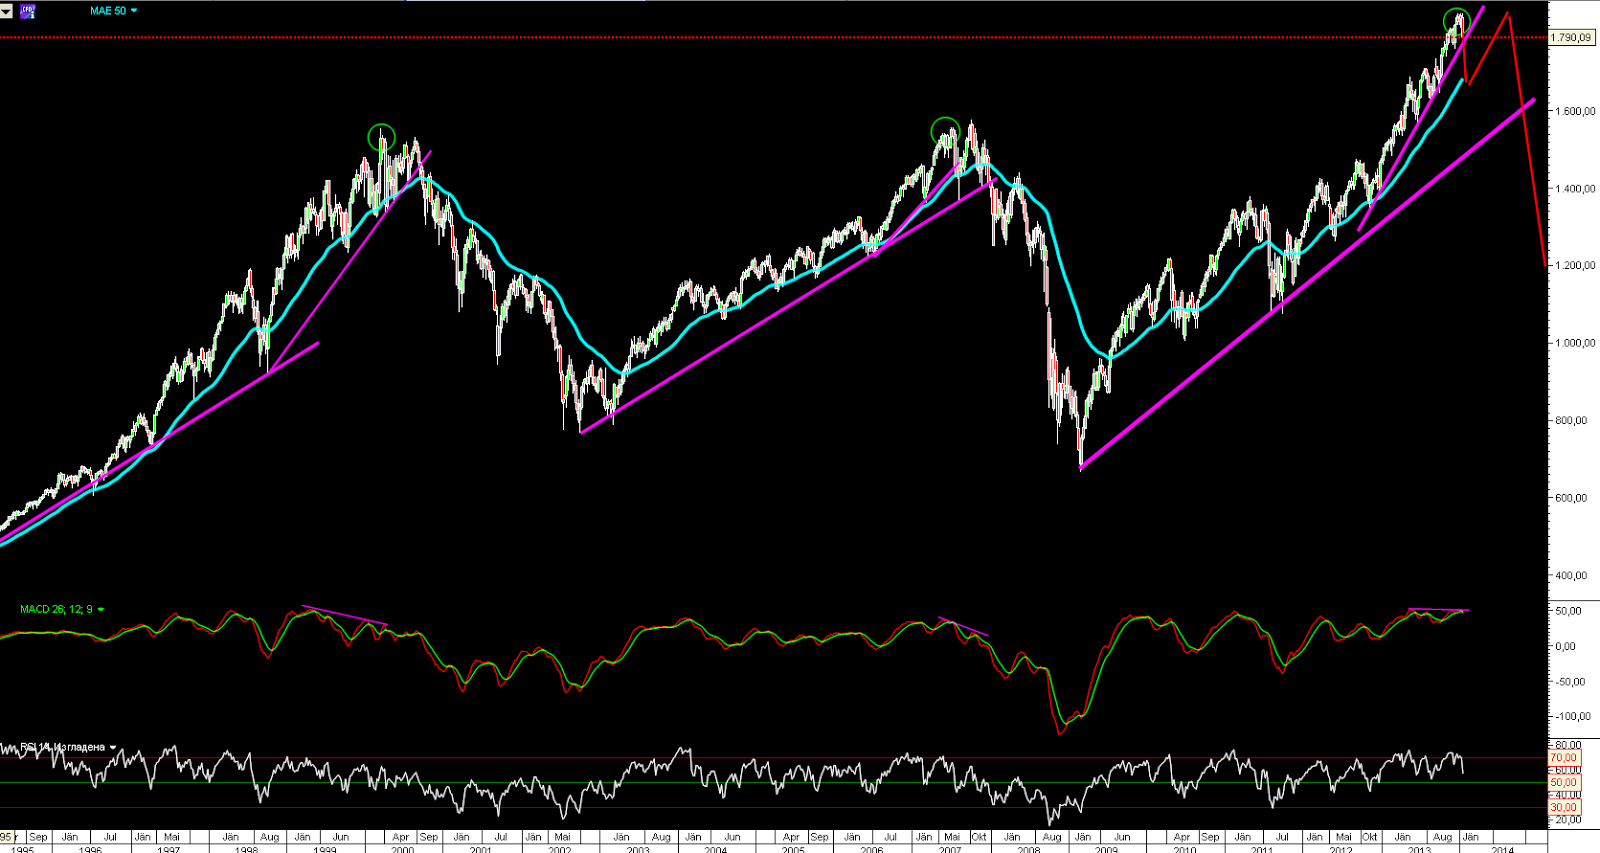
Here is visually what I expect... I think we will see something similar like in August 2007.
Why not just a pullback? - The price is way too far from MA50 - the rise is much steeper than 2000 and 2007, too much greed means to expect sharp correction (no correction for more than a year), 18 month cycle top - we always saw several weeks correction(see the previous post weekly cycle chart). Add to this ugly indicator divergences and extreme sentiment. That is why I do not expect only a pullback 1-2 week event.
Why only correction? - it could be only correction followed by another high or THE TOP. I do not care a lot which scenario because even in worst case (the bull market toped out)
the top will be tested. Bear markets usually does not start with a crash, a trend does not change this way MA50 will be tested and we will see a bounce, the next 18 month cycle
is coming and we should see at least 2-3 months to the upside, the central banks will come to the rescue.... etc.
So my best guess is sharp correction at least 3 weeks max 6 weeks - first target around 1650 support and MA50, second target 1550 support from the 2000 and 2007 tops and the lower trend line.
After that it does not look good for the bulls... I have posted this chart several months ago - a bull market accelerates before it ends. When the accelerated trend line is broken the long term trend starts reversing(topping) - MA50/trend line is tested, another rally follows with new high and divergence or lower high... the usual trend reversing process which you can see on every time frame. The difference is that this test of the high could last very long 3 months or 6 months....

Lets say I am right, than look at the charts bellow - this is SP500 charts in 2007 daily and weekly. I think we will see something similar.
One day relief, another plunge support is at 1770 and 1750(more likely), 29-th FOMC FED comes to the rescue and retracement to the upside follows, final sell off to 1650. If you are bull you want to see the same pattern - 3 wave structure corrective, short living 19 trading days or 4 weeks in 2007.
Correction for 4-5 weeks MA50 and the trend line were tested to the downside, followed by a rally to the highs with divergence.


Thanks for your thoughtful insight and analysis Krasi. Any thoughts on EEM? Is a bounce coming?
ReplyDeleteThanks!
DeleteEEM - this is a tough chart to read:) very complex corrective structure for more than 2 years...
I think when the current move lower is over there will be another leg higher above the last high 43.52 to finish double zigzag - we have W-X and now in B of Y , C higher to follow.
The prediction stays valid if EEM makes a low above the last low 36.84... if you notice the corrective structure which begun in October 2012 is moving upwards and every move lower made higher low. If it makes lower low it is getting dangerous and probably something else is going on.
Thanks for your insights on EEM. Really appreciate it Krasi!
Delete