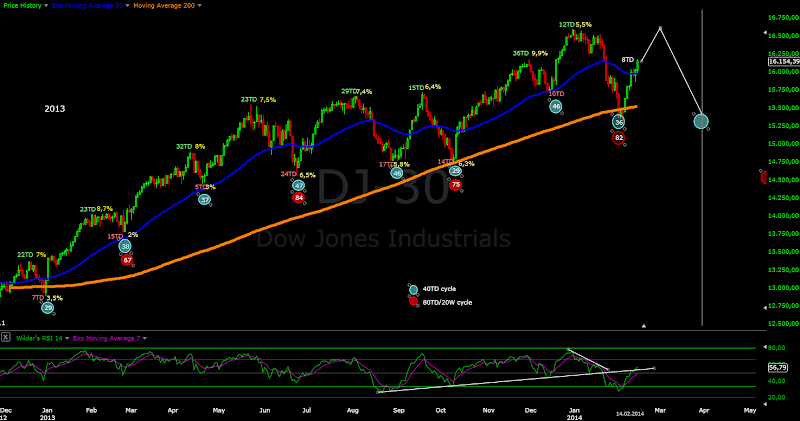
Short term view - short pullback and new ATH.
Intermediate term view - 2-3 weeks more upside and than another sell off.
Just follow the market higher was the right think to do... it moved even higher than expected. Who cares about the forecast if you are on the right side:)
My advice stays the same as last week "follow the market higher". Keep it simple, you do not need to think too much. We have clear support level 1810 and MA50 on the daily chart. Start worrying if the price moves bellow that level.
Now the forecast - I think we have intermediate term bottom and 18 month cycle low and we will see at least 2-3 weeks up move before anything to the downside. My personal view this move was way too shallow as time and price, Investors Intelligence bears before the correction 14,1% after the correction 17,4% - 17% is still extreme low no fear at all too much greed. And because there were no fear I think this move will not last very long and it will make only marginal higher high and fail. Because of this reason I think, that there is no fuel for another huge rally - for now the volume confirms it (it's less than to the upside) and indicators and some indexes(RUT,DJ,XLF) are lagging.
If the forecast plays out great, but what if I am wrong? - well we stay open minded. This is 18 month cycle low and the rally will last at least 2-3 months. But we have a rally lasting more than 15 months without correction, how much higher? - full blown parabolic move and collapse as every parabola.
TECHNICAL PICTURE
Short term - if the move is so strong any pullback should find support around 1810 and after that a new ATH should follow... than we will see how the charts look like.
- Triple cross(EMA10 and EMA20 crossing EMA50) - short term trend is up.
Intermediate term - red scenario just follow the price. In green what I think it will happen, this is just a forecast nothing more for now.
- Trend direction EMA50/MACD - MACD moved above 0 and the price above MA50 - intermediate term trend is up.
- Momentum Histogram/RSI - momentum is up, short term trend is up.
Long term - another green candle confirmed the hammer so the price action is bullish for now and should just follow the market in the next week or two. I do not think that this move will clear the MACD divergence and the move will fail to start another long lasting rally.
- Trend direction EMA50/MACD - the long term trend is up - the price above MA50 and MACD above zero. The MACD divergence should make you worry, that the long term trend can reverse soon.
- Momentum Histogram/RSI - momentum turned up - intermediate term trend is up.
MARKET BREADTH INDICATORS
The Market Breadth Indicators - oscillators like McClellan Oscillator a strong which is not a surprise after a vertical move, the trend following indicators are not convinced.
McClellan Oscillator - near overbought levels, probably a pullback will follow.
McClellan Summation Index - buy signal,turned up.
Weekly Stochastic of the Summation Index - still on sell, it is a lagging indicator. If my forecast is right it could not issue a buy signal at all.
Bullish Percentage - really weak for a such rally. SP500 is near to it's highs and Bullish percentage barely moved 6 points and it is far bellow the last highs.
Percent of Stocks above MA50 - moved higher after hitting mildly oversold level 25, but still bellow the previous highs.
Fear Indicator VIX - complacency everywhere again. Do not forget - these are levels where VIX is a buy.
Advance-Decline Issues - near overbought levels.
Put/Call ratio - pullback a little bit after the correction, but there is no fear still at elevated levels
HURST CYCLES
The move last week looked like a 20 week cycle bottom now we have the confirmation. 82 trading days nice cycle length. Now the next 40 day cycle is at day 8. If there will be something to the downside the 40 day cycle should start move lower early in the cycle something like day 15 to 20 an this is 2-3 weeks max to the upside.
18 month cycle bottom if I am right. Usually you will see a strong rally lasting for months, but after 15 months without correction it is a little bit suspect.... The alternative is some kind of a top - double top or H&S and top of the 5 year and 9 year cycle. The line in the sand is 1740 the bottom of the last 18 month cycle if the current one moves lower this will mean the cycles of a higher degree 5 and 9 year have toped out.
Tom Demark SEQUENTIAL AND COUNTDOWN - this technique spots areas of exhaustion.
We have price flip on the weekly chart and momentum has turned up. On the daily chart we have 6 of a sell setup and I think it will be finished.
Subscribe to:
Post Comments (Atom)


No comments:
Post a Comment