Intermediate term view - the correction to continue for 2-4 weeks.
SP500 squeezed a few more points higher, but then turned lower as expected. The move lower looks like impulse to me, which means to expect more to the downside. Despite the strong retracement I think it is corrective and the direction is lower. Wave C lower for expanded flat looks best to me at the moment, so the plan stays the same. Alternate options if I am wrong - more bullish only one more leg lower for a-b-c - than it will look like wave C of a giant triangle for around 4 months since first of March until end of June/early July. Second option more bearish the correction is much bigger and this is just the begging of wave A lower. We will just watch how the price action develops. TECHNICAL PICTURE and ELLIOTT WAVES
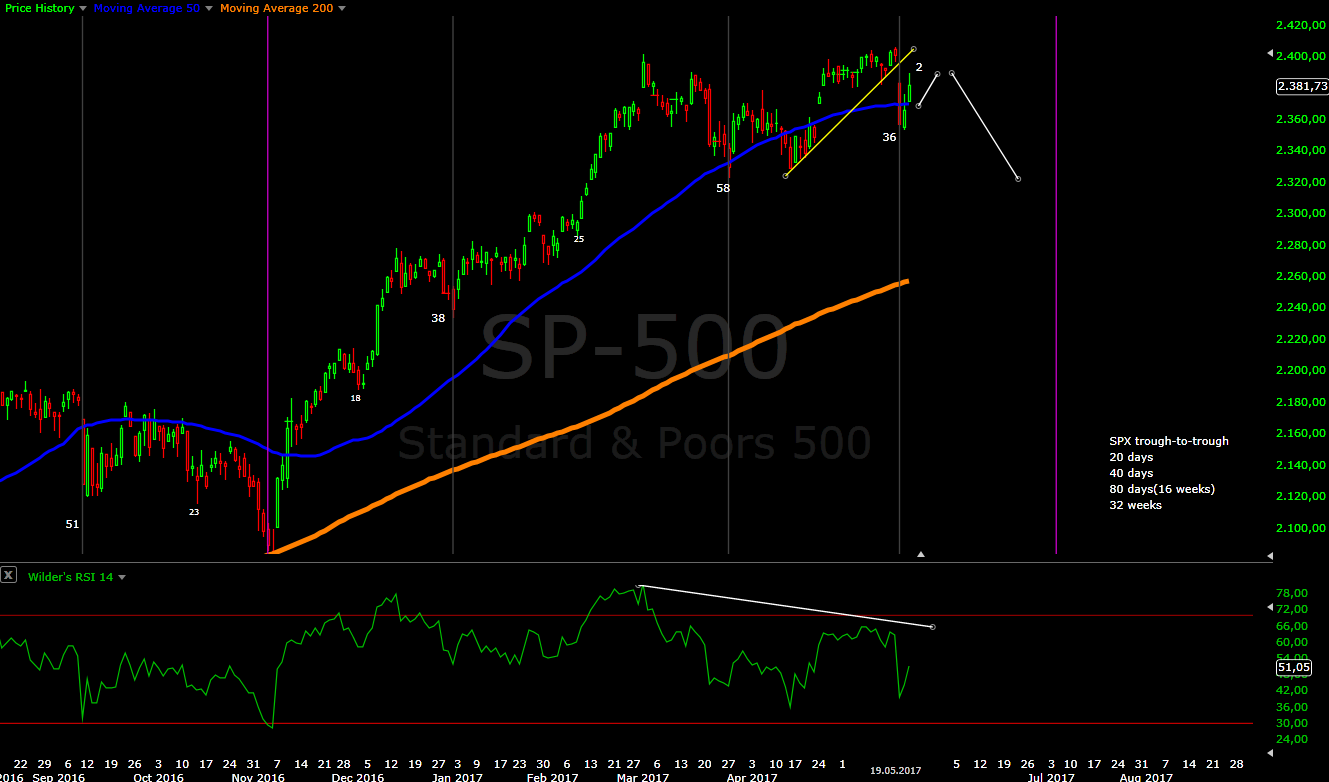
Short term - after an impulse another one in the same direction follows. If we saw wave 1 and 2 this week the Fibo measurement for an impulse point to a low around 2280 which is a support level(better visible on the daily chart).
The alternate options - with green triangle and red wave A of 4.

Intermediate term - MACD/RSI with divergence... expecting wave iv(green) to support, alternate it could be wave 4(red). Now waiting and watching how the move develops.

Long term - looking the oscillators(RSI,Stochastic with divergence) I think we should see a few weeks lower so that they can reset to at least the 50 level.

MARKET BREADTH INDICATORS
Market Breadth Indicators - are pointing lower and are not even close to oversold.... there is a lot of room to move lower.
McClellan Oscillator - below zero.
McClellan Summation Index - sell signal.
Weekly Stochastic of the Summation Index - sell signal.
Bullish Percentage - sell signal, now below 70.
Percent of Stocks above MA50 - in the middle of the range.
Fear Indicator VIX - spiked higher, curious to see if it will make a higher high.
HURST CYCLES
It is possible that we have one finished 40 day cycle. I have changed the weekly count and one shorter 40 day cycle plus one more to finish 20w/40w/18month cycle is expected.
Week 7 of the last 20 week cycle. I have changed the count, this move higher lasted too long and I think we have length 20 for the previous 20 week cycle and the current one caused the rally from April. It fits better with the price action, visually looks better... at the end it is only cosmetic change - instead of something like 11+20 we will have 20+11 for the 40 week cycle.

Tom Demark SEQUENTIAL AND COUNTDOWN - this technique spots areas of exhaustion.
This few points higher fit perfect - the minimum requirement for the last bars 11/12/13 is to make higher high. So if we take the minimum requirement we have finished countdown/combo on the weekly chart.

Hello, I thought wave c of expanded flat is always 5 waves not 3 waves..
ReplyDeleteYes, it is 5 waves and I have drawn impulse see the first chart.
DeleteKrasi-looking at TLT and USDJPY (which appears to hold the key not only to gold but also the S&P) I wonder whether we may in the short term get a move higher in gold only to abruptly move down as USDJPY makes new highs? New highs in USDJPY as you have continuously forecasted would correlate nicely (as I see it) with new highs in the S&P. We could make a double bottom in the gold shares with the 2016 lows blowing out sentiment come late June into July.
ReplyDeleteBonds correlate very good with stocks, USDJPY correlation with stocks has disappeared.
DeleteBonds are heading higher to finish wave 4 then lower, stocks lower to finish wave iv or 4 then higher.
DXY is making 1 year and 3 year cycle low and should move higher for several months. USDJPY should move higher too so PM should move lower for an important low in Sept-Oct-Nov time frame.
Thank you
DeleteGold should rebound from now until June/July for several weeks like last year? Thanks. I thought by the end of May it should bottom in intermediate terms?
DeleteThe time frame for an intermediate term low was May/June it looks like it made a bottom in May a few weeks earlier, so yes we should see it higher in June and for July.. I can not say at the moment.
DeleteThanks Krasi...
ReplyDeleteWhat are your thoughts on the RUT/IWM. can it also be a big triangle...in which case what levels for the C wave. thx
Yes, triangle is possible. One more lower low is needed for a finished a-b-c for C of the triangle - level between the two previous lows from March and April 1335-1345
DeleteThx Krasi! one elliot wave question for you: does WXY pattern allows for a new all time high? im wondering if in RUT: what we have is minor 3 at 1414. W ending at 1335 low. Currently we are in X with a completed at recent high of 1425, b unfolding and now we are going higher for C wave of X. your thoughts?
DeleteSuch count does not look right. Waves W and Y are zig-zags. Corrective waves which make higher high are expanded and running flat. The last wave of a flat should be impulse and not zig-zag. If we see one more higher high I would rather say this is wave (iii) of ending diagonal for wave v of 3 from the Feb.2016 low.
Deletethx Krasi...good point. they keep holding this market up.
ReplyDeleteSorry to sound ignorant. Does this mean that S&P is now expected to make a new high after decisively closing above 2390? Or there is still a chance of a lower high?
ReplyDeleteIt is not ignorant this move up lasts too long and too high for a C-wave... it should have completely different personality. There is two options - triangle fits for most indexes SP500,DJ,NYSE,RUT(yes there is a chance of a lower high) and second option wave (iii) of v of 3 is running(expect higher highs).
DeleteThe move up looks like impulse now and after a pullback it is a good idea to get rid of shorts.
Do you think gold miners has already bottomed? Thanks. SPX seems to reach extreme in short term.
ReplyDeleteThere is now a-b-c lower... if it will reverse and rally I do not know. Looking the indicators and the short cycles - not so bullish.
DeleteSPX looks like a triangle to me at the moment.
Hello Krasi, by saying the spx looks like a triangle at the moment , you mean the wave 4/correction is behind us and it's time to close shorts and even get long for wave 5 and new highs this summer? Thank you very much.
ReplyDeleteNot exactly, if it is a triangle it is still running so wave 4(or iv) is not over. Other option is wave v of 3 is running as an ED. The point is there is no reason to be short, now there is impulse higher, the risk/reward is not worth any more. I think will see higher prices before another good short entry.
DeleteThe long trade... it does not look very interesting either with so close to 18 month cycle low.
My feeling is gold/gold miner still has room to go down until bottom next week? Thanks. It appears to be impulsive move. And still wave 4 and 5 left...
ReplyDeleteHi Krasi. Since you've been expecting a correction and the markets are at new highs, how do you explain that you've been so wrong ? What will you do in the future to get better and avoid these big mistakes ?
ReplyDeleteBest regards
Hi, your question sounds like I should know the future:) This is trading and I can not see in the future. Most of the time I am on the right side, but not always. It is a big mistake if I miss an important top/bottom.... or let's say intermediate top/bottom - a few days do not qualify as big mistake, especially such V-shape moves down and up.
DeleteSo when you make mistake you look back and check if you missed something, or your chart interpretation was wrong to avoid it next time. In the current situation - I do not see "big mistake". The only surprising fact was that we did not saw short squeeze after the price making new high... now we have it - vertical move on ever shrinking volume.
Nothing has changed, the next bigger move is lower.
How about PM and miner stocks? It seems gdx/gdxj are gradually bottoming? Thanks.
DeleteGuys, please show a little respect for Krasi! I have been following him over 1 year now and he has saved me from making disastrous mistakes.
Delete1. This is not a paid service so he owes nobody anything.
2. You have to decide whether you agree with his analysis and take a trade! It's so easy to never take responsability for one actions and blame others. Please grow up whoever wrote about him making a mistake.
3. Time will tell whether he is wrong. Open Interest and many other indicators I follow still point to a move lower.
Thx Krasi for the help you give each of us. Don't let a loser kill your spirit
I do not take it personal... there was a time I was very emotional and this would affect me, but this is behind me.
DeleteIf someone wants to be a trader one of the most important things to understand is that sometimes you will be wrong and make loses - it is unavoidable no need to fight it just accept it. I accepted this fact.
I was wrong. I admit it, I do not know a way to predict such V shape move.
I looked back, I do not see some wrong interpretation of the charts. I move on to the next setup. This is trading, business as usual.
Krasi, just keep doing what you have doing. Do your best and keep a fresh open mind. It is up to each of us to determine whether we will risk our money or not. The majority of the people who read your blog would probably agree. thanks.
ReplyDeletePM are really difficult to read... Gold looks like impulse from the low, Silver like a-b-c, GDX/GDXJ like impulse higher and correction a-b-c from the recent top, some miners look strong some weak.
ReplyDeleteI think the PM sector will move higher for a while, but I do not think we have important low behind us. I am not trading it, I am just waiting for a more clear picture.
Thank you very much. I also feel strange that GDX should have another wave lower next week or so... Thanks again for your help. Emotional feeling is top enemy to trading. People without correct attitude would not win finally. We really appreciate your work.
DeleteMaybe Krasi should take some time off. That's what I do when I make bad decisions. It might be a good idea to take a couple of months off for Krasi, and to come back fresh and kicking.
ReplyDeleteThanks Krasi, for sharing information and perfect calls. charting and rules connected to it is all probability science, it means we are doing our best to fall on right side, But as I said it is all based on Probability with high percentage, Nothing is 100%, if some one expect 100% then he/she should follow God in order to get 100% accuracy :)))) . some of us really need to be more resonable and Learn from this blog, and respect Krasi for time and effort he put for this. I know some other Guys who charge for their prediction /forcast and most of the time they are wrong, they charge big time.
ReplyDeleteThis blog is one of the blogs that I have improved my knowledge/and the way I am looking/analysing at the market, and always appreciate Krasi for this blog and his responses to comments.
ReplyDeletelove your blog Krasi! but can't stand the trolls hiding behind the computer. keep up the good work Krasi.
ReplyDeleteHi krasi!! Love your blog, it's about discussing markets, let the idiotic trolls mumble.... waiting for your weekly updates with tremendous impatience :-))) good luck to all... jd
ReplyDeleteI have seen much worse, it is possible that it was not meant offensive... I just find it exaggerated to call it big mistake and to think of a pause. It is more like daily business for a trader.
ReplyDeleteI wrote in March that I am trying to find the top of wave iii of 3 in a bull market and most likely it will not work - well the market found a way to twist the pattern and fool most of the traders. Reversal lower with five waves lasting only one day and another reversal V shape recovery - shit happens move on to the next setup.