Trading cycle - buy signal. I think it is dangerous to be long, because I expect the same cycle setup as Jan-Feb this year - double top and turn lower.
TECHNICAL PICTURE and ELLIOTT WAVES
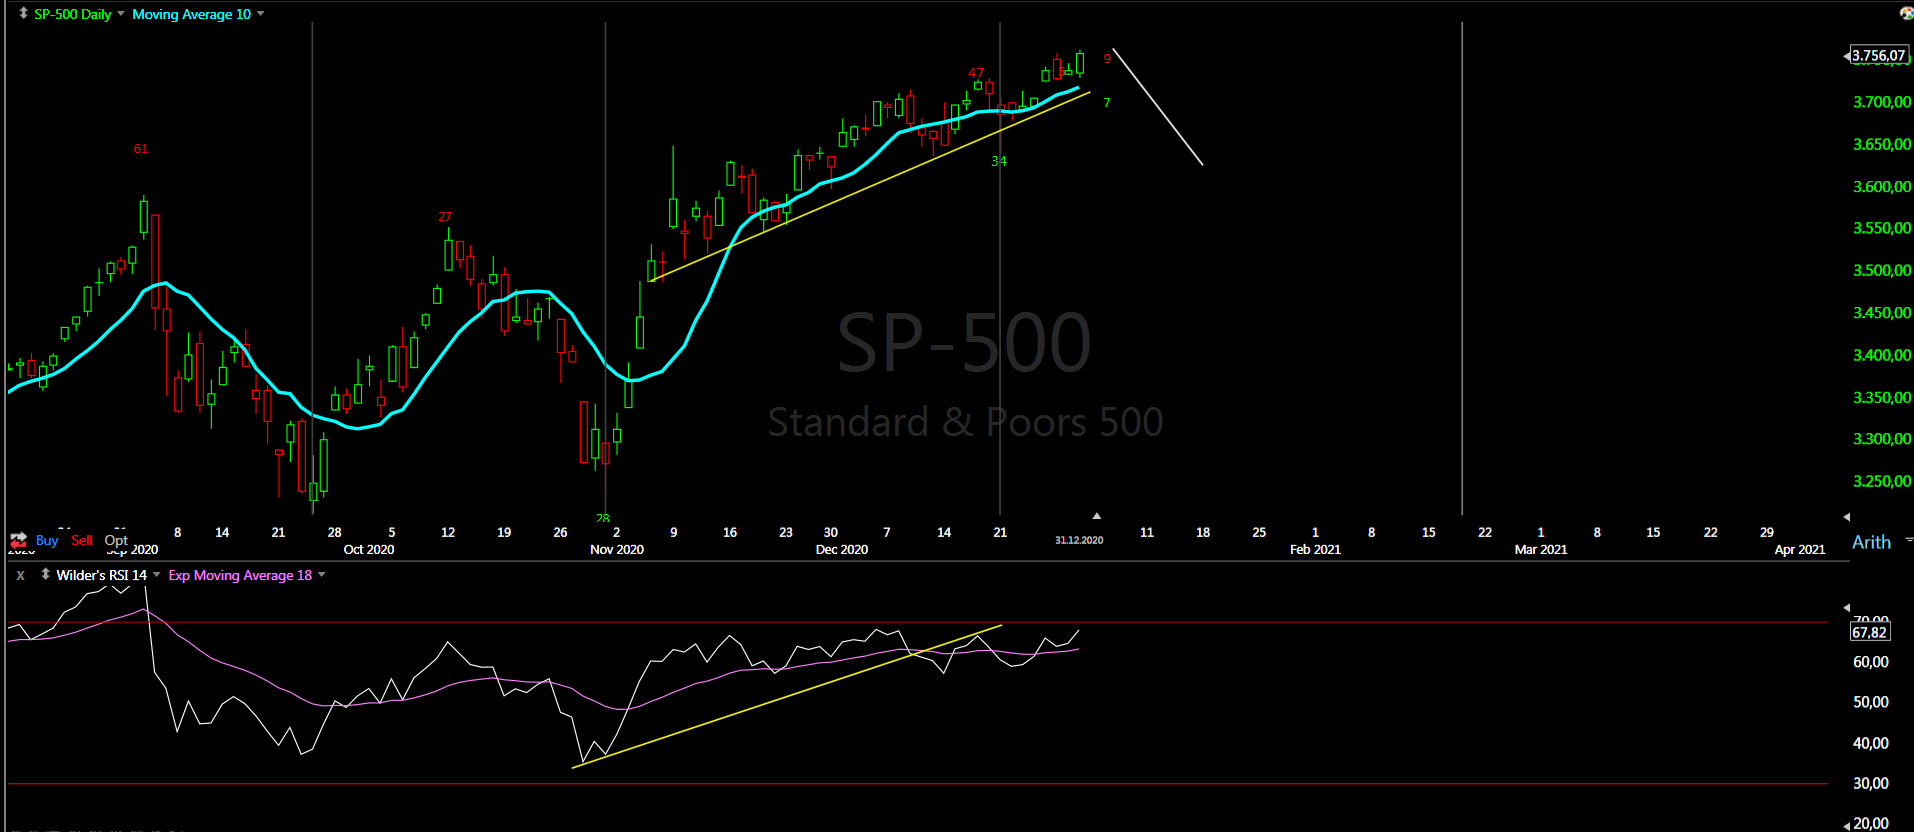
Short term - I think we have diametric for the c-wave and the last wave itself is a diametric, which needs the final two waves to be completed Below 3690 means with high probability we saw the high for this c wave, confirmation is below 3640.

Intermediate term - nothing new, the indicators with long and short term divergences warning for a high. Neowave pattern symmetrical completing at 18m high looks good. Classical EW pattern should be W-X-Y with the catch that there is no impulses.
Alternate this is THE top. I do not believe it much, but if we see the last move retraced in less time like 3-4-5 weeks we have reversal.

Long term - the bull market completed in 2018. Since then a bunch of corrective waves. Currently I think this rally should be a corrective wave of a bigger pattern most likely triangle. Look at NDX we have corrective wave which is 1,618 bigger than the previous one which could be only b of a triangle. I think the best looking pattern is Neely's triangle. Alternate pattern, which makes some sense and works with cycles, is mega expanded flat

MARKET BREADTH INDICATORS
Market Breadth Indicators - looking toppy with divergences, but still not serious turn lower.
McClellan Oscillator - around zero.
McClellan Summation Index - sell signal.
Weekly Stochastic of the Summation Index - sell signal.
Bullish Percentage - short term weakness with divergence, but still above 70.
Percent of Stocks above MA50 - something like double top?
Fear Indicator VIX - short term divergence.
Advance-Decline Issues - weak sligthly above zero.
HURST CYCLES
Short term cycles - expecting to see 20d high and turn lower, ideally something between 1-3 days.
It seems we have nice rounding top and it seems we have to dominant 20w cycle with bell shape. This is the reason why the shorter cycles 5w/10w are not well visible.

Week 9 for the 20w cycle. The indices are at 20w cycle high and turn into 20w low is around the corner.

Tom Demark SEQUENTIAL AND COUNTDOWN - this technique spots areas of exhaustion.
We have completed sell setup on the weekly chart. The previous two occasions marked intermediate term top for 20w and 40w cycle high.

Hi Krasinski can you be kind of enough to share again your long term forecast upto 2030 and after 2030. I believe it was about deflation and inflation related and how stocks, real estate will perform etc.
ReplyDeleteThe idea is that the USD has a few more years lower into 16y low and after that higher into 2032 for 16y high(see the charts in the previous post below). The commodities are doing the opposite.
DeleteThe USD lower is inflationary environment, the USD higher is deflationary environment.
Example USD higher 2011-2016 precious metals lower. After 2030 expect for commodities the same period like 2000-2011 huge up, which will cause huge inflation.
Stocks do not have the same direct correlation like commodities with USD/inflation.
USD will go up because everybody will need dollars(defaults like 2008), which will cause selling in all assets and stocks will be hit hard. Then when everything is over stocks will be up because I suspect this will be the beginning of the end for the USD as world reserve currency.... which means huge inflation so stocks commodities up.
For the real estate I have no observation what is going on... but I doubt it will be different. The situation is such that all assets are moving together against the USD. When liquidity disappears and we see defaults I doubt the real estate market will be spared. After that buying when everybody crying should be a good investment in real estate.
Sorry Krasi, it was a typo on your name
ReplyDelete10 days low today?
ReplyDeleteMore likely heading into 20d low and 10d low at day 6 Dec.30
DeleteIt looks like reversal and the count accordingly the diametric in diametric to complete c-wave for a zig-zag from the low on the last day of October - https://invst.ly/tc6jb
ReplyDeleteCycles 20w high and now heading into 20w low for 4-6 weeks.
thought we would have got a bounce today.. but we didnt..
Deletemarket doesnt seem right.. feels weak..
Hola Krasi. Ya se que solo pones el mercado de Usa. Qué piensas del Ibex, España. Bajaremos mucho más que el resto. Como el año anterior. Gracias. Javier
ReplyDeleteIt should follow the same path down,up and big down like this - https://invst.ly/tc9eq
DeleteMuchísimas gracias. Javier
DeleteWhen we speak about IBEX or other indices like RUT/XLF how can they have the same pattern like SP500? The answer is like this with X triangle - https://invst.ly/tc9ia
ReplyDeleteIt is the same just synchronizing the pattern across indices....
talking about ibex, this guy has uploaded 3 long term counts, in case someone else is interested:
ReplyDeletehttps://www.labolsadepsico.com/ibex-escenarios-2021/
I think there is others counts possibles, what do you think?
https://invst.ly/tca4l
Deletehablando del ibex mejor ni hablar
ReplyDeletePlease Krasi what do you think about italian index FTSE MIB? Could you post a chart like Ibex?
ReplyDeleteIt is the same like IBEX...
DeleteStill think it's a reversal? It's stubborn.
ReplyDeleteYes, this time the move up is corrective.
DeletePretty impulsive C wave so of a correction taking place?
DeleteKrasi: Not a trading question but trader psychology question. You are among the best when it comes to analysing markets. How do you deal with FOMO? Every Tom, Dick and Harry is making money in technology stocks, EV stocks, bitcoin, crypto, penny stocks and just about anything. If you are not taking part in this craziness and not making all the big money, don't you feel missed out? Don't you feel that being the expert, you should have conquered it all and made the big money? They say, there is nothing more irritating than watching your neighbours get rich. Any suggestions on how to deal with this feeling of loosing or FOMO?
ReplyDeleteAsking for a friend... :-) Muchísimas gracias!
The psychology question is why do you make the conclusion avoid long trades?
DeleteI hear over and over the same - you missed it/shorted it just because I say this is corrective wave and it will be retraced. No idea why everybody make this conclusions..... I must be bearish from bottom all the way up- why???
The analysis says this is corrective wave and not do not trade it.
In March when most comments were how much lower SP500 will go I wrote several times do not be scared look for opportunities.
Any thoughts on BTC?
ReplyDelete18m high now and major high with the indices in 2022.
DeleteETFs and institutional buyers squeezing the price higher. When the liquidity dry up and SHTF it will plunge like everything else... until then enjoy it if you have BTC.
Thank you. I have many friends that are investors, but I am not. Move looks parabolic rather stretched in my opinion and I was telling them that I would expect a pullback to the $24k area in the coming weeks with consolidation for a month or so before it moves higher. Sound about right? As always, thank you!
DeleteHi Krasi, what would cause the liquidity to dry up anytime soon?
DeleteKrasi still not worry about tlt break down?
ReplyDeleteNo, I do not see the right conditions for a break down.
DeleteI am concerned and surprised by your answer...there is a break down on the daily charts (2 and half months of trading range between 155 and 160)...it might be a fake break down but there is one for sure!
DeleteThis is the completion of a pattern and not the start of a new move.
Deletemaybe ...or maybe not...today down again...and if the move accelerates it might be the real reason of why the equity market might correct...
DeleteI see it differently - first we have risk off trade stock go down and bonds higher then stocks should test the top and something happens and all assets are hit hard like March last year.
Deletei think that this time it might be the other way around...first long term rates explode higher...and then the equity market should follow on the way down...right now you if you look at weekly charts of tlt or tyx this is the story that i see...and today is super important to see how the close...it reminds me of the breakdown of gld in april 14 of 2013...
DeleteIndu on a tear - looks like it wants a print over 31000 at min .Spx really needs to close lower than this today or it'll be a breakout over long term resistance . Bears had a one day wonder on monday - again.
ReplyDeleteNothing changed.... still the same corrective crap.
DeleteCurrent thoughts - https://invst.ly/td4wz
ReplyDeleteThe diametric extends to symmetrical with one more zig-zag.
https://www.gmo.com/asia/research-library/waiting-for-the-last-dance/
ReplyDeleteToday is a good example of why I don't trade on news. Thanks for the update Krasi!
ReplyDeleteStill expecting the top this week? Thanks
ReplyDeleteYes
DeleteHow can we fit the cycles to see a 20w high the next week or the next one?
ReplyDeleteYou have to push the 10w high and low further... which will make them too long the 10w high 15 week long which is not very likely.
DeleteRipping higher again. Is this parabolic?
ReplyDeleteDXY breaking up out of wedge, I think the turn is today
DeleteFinal blow off for the expected top this week.
Deletewhy this week?, 5w high in 8-10 days more
DeleteIn this case I think we have different cycle count like:
Delete- we still have not seen the 20w high, which means 10w high and low 14 weeks long.... which is not very likely.
- the next 20w cycle high is running, but where i the 20w low....
- the only option to solve this is some very strange running correction.
So I stick with my analysis and waiting to see what happens.
I have looked more closely other indices and RSI and think this count looks better - https://invst.ly/tdr6w
ReplyDeleteIt's still going up
ReplyDeleteI don't know why people get sucked into picking tops. You look foolish every time it soars to new highs after!
DeleteIt's just to say that we still up in all of the time we are looking
ReplyDeletetoday looks different so far
ReplyDeletevery different
ReplyDeletewhat market are you watching?
DeleteNot much different
DeleteDifferent for metals only :)
DeleteIn what way?
ReplyDelete