Trading cycle - buy signal, more closes below and above MA10/RSI crosses. The same - expecting setup like Jan-Feb and turn lower.

TECHNICAL PICTURE and ELLIOTT WAVES
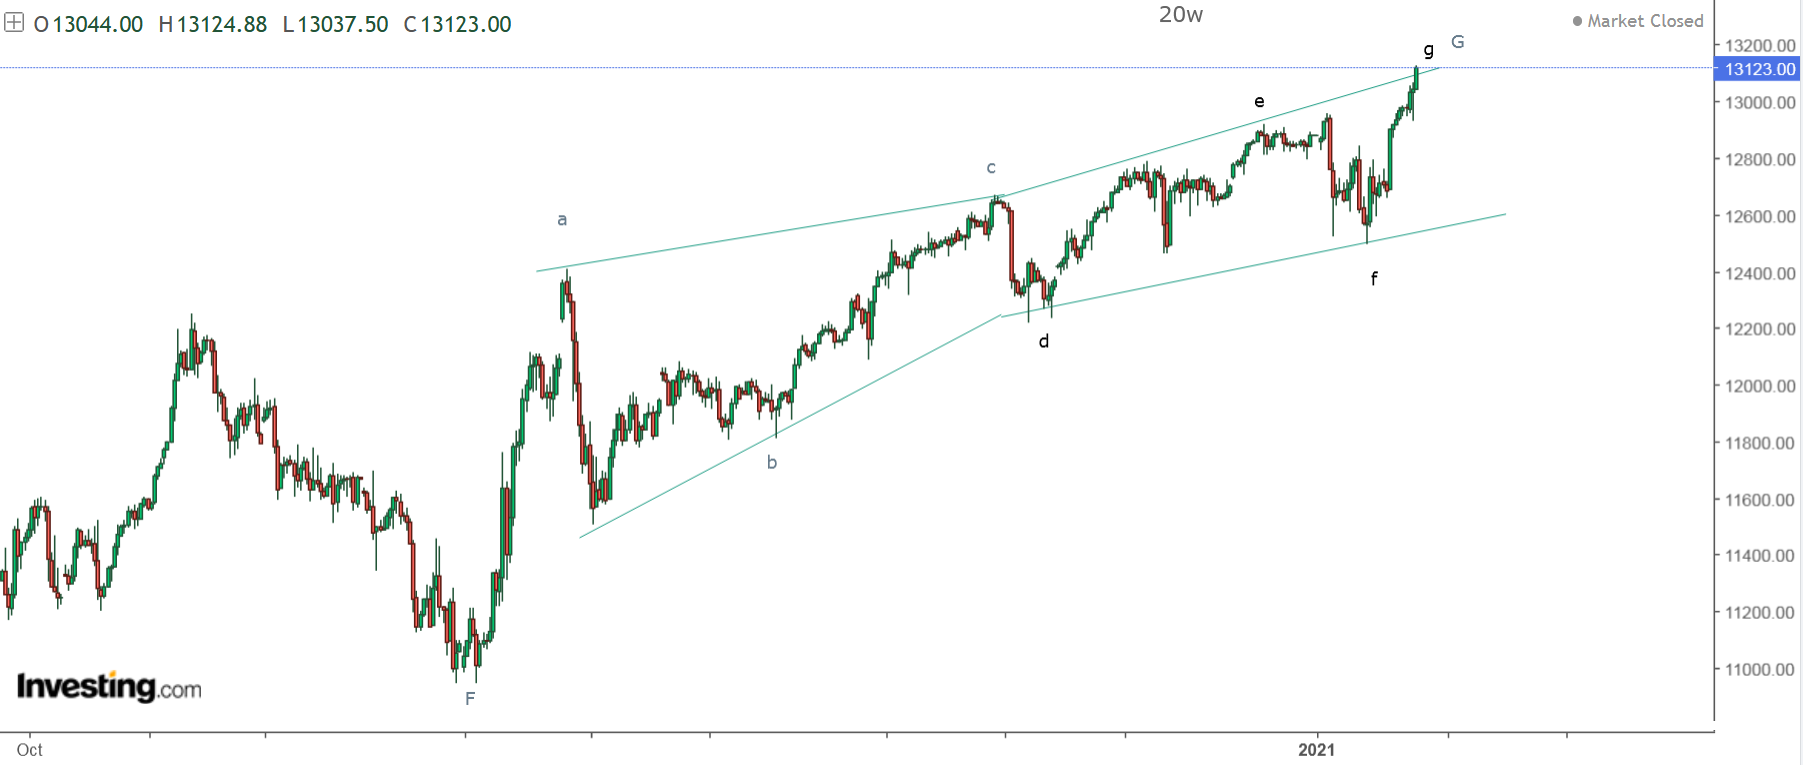
Short term - you can count a-b-c with c=0,618xa, another option is the whole move from the November low is diametric not just the c-wave. It works for indexes like DAX,SP500 and others, but it is best visible on the NDX chart.

Intermediate term - nothing new, the indicators with long and short term divergences warning for a high. Neowave pattern symmetrical completing at 18m high looks good. Classical EW pattern should be W-X-Y with the catch that there is no impulses.
Alternate this is THE top... still the pattern high should be later, but if we see the last move retraced very quickly like 4-5 weeks we have reversal.

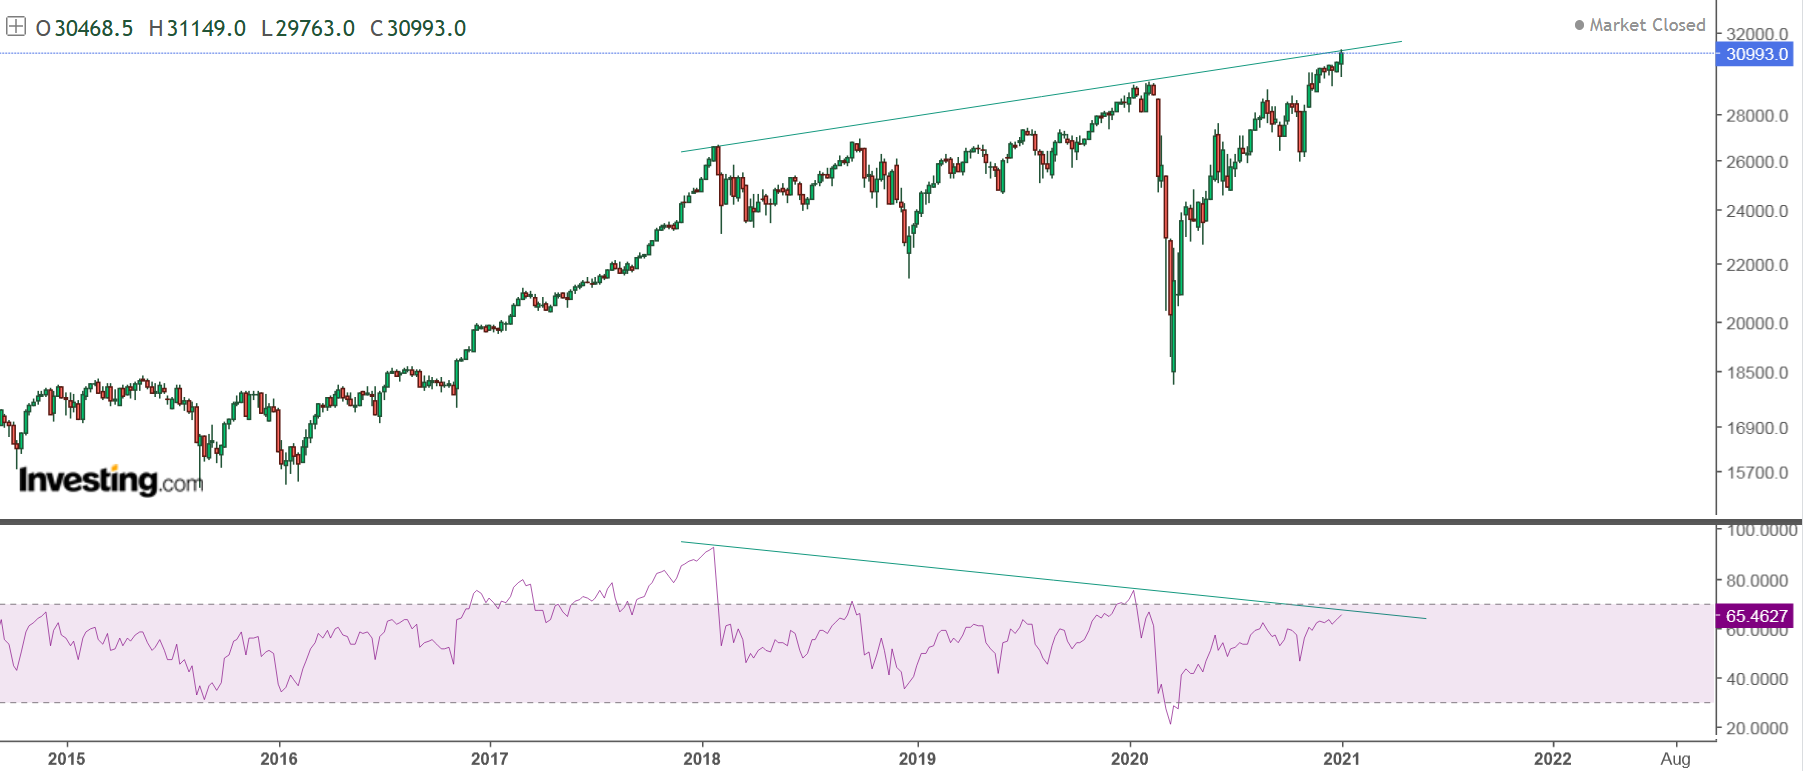
Long term - DJI weekly chart another touch of the trend line with double RSI divergence does not make me feel bullish.
MARKET BREADTH INDICATORS
Market Breadth Indicators - oscillators turned up, but weak with lower highs so far. This three days up do not show some big strength.
McClellan Oscillator - slightly above zero.
McClellan Summation Index - sell signal.
Weekly Stochastic of the Summation Index - sell signal.
Bullish Percentage - bounced from 70 lower high so far.
Percent of Stocks above MA50 - bounced from 75, lower high so far.
Fear Indicator VIX - higher low, short term double divergence.
Advance-Decline Issues - turned up from zero, lower high so far.
HURST CYCLES
Short term cycles - this time the DAX, because it shows more clear what is going on. I still think we have 20d high and next is decline into 20d low.

Week 10 for the 20w cycle. The indices are at 20w cycle high and turn into 20w low is expected.

We did not top yet, RSI is at highest level since Sept high. We need one more pullback and rally to complete move. No top until end of the month.
ReplyDeleteALso the move down that comes next is anyone's guess how far it can head down. It can go down anywhere from 3000 to 2200.
I remember when people said 3800- 4000K was for sheep. Sigh.
ReplyDeleteI think it goes back to the point where you can ride it all the way up and become over confident that it won't decline, especially after you see these 100 point drops intraday get beaten back up to new ATHs, you think you are invincible, when suddenly, one day the 100 point drops doesn't get beaten down and it turns into a landslide which doesn't stop. It's just as hard psychologically to get out on the way down. As Jeremy Grantham said, you may miss the top, but getting out at a reasonable point near the top is advisable. Traders are way over-confident at the moment. Plenty more black swans to come in the coming months.
ReplyDeleteVery well explained with few sentences!
DeleteI had comments like why bother trying to find a top - simple you need to know when to stop running with the herd and it was this week.
Plenty of examples to confirm it - for example Feb.2020 would it be so bad to take profits lets say at 3200 three months earlier.
What is the point of cheering 3800-4000 for example when majority will not take profits and watch 200 points evaporate in days and you are at August-September levels 4-5 months back.
Taking at least partial profits is smart and the goal of the analysis is to tell you when.
Of course my analysis is stupid because it can not nail the top as if this is the goal.....
Irán ha amenazado vía diplomáticamente que o le dejan hacer Uranio o van a la guerra. Ya lo saben los 2 presidentes americanos. Y los demócratas siempre van a la guerra. Así que en febrero blanco y en botella.
ReplyDelete"So in February white and bottled"?????
Deletehttps://ejmagnier.com/2021/01/08/iran-challenging-trump-and-giving-biden-no-choice-an-imminent-deal-or-no-deal/
DeleteHai krasi...finally ... I found your blog again
ReplyDeleteKrasi..market continue High 14 and decline into jan 18? Thank u...
ReplyDeleteRegard,
Sandi
For such short term time forecasts I can use only the 10d/20d cycles and I can not nail it exactly the day.
DeleteYour dates look too stretched - usually the cycles are 10-12 days long. Another day is ok 14th looks too stretched... unless completely new 20d cycle is running.
Thanks....God....
DeleteKrasi, thank you very much for the weekly update above. For the first anticipated downturn, which index (S&P, NASDAQ, RUSSELL2K, or DJIA) will experience the greatest PERCENTAGE drop before retesting the near-term high that will take place before THE HIGH. And would that answer/opinion apply for the drop after THE HIGH as well? Thanks much for all you do to provide your expertise.
ReplyDeleteI can only guess - looking at the levels, where each index should drop to I would say RUT.
DeleteI appreciate your "stab" at answering my question(s). Been curious on this due to overzealous run upward on both RUT and NASDAQ. Buying EVERY dip is going to bite some people one of these days. Thanks again for all you do here at your blog.
DeleteRut was weakest Friday, might be a clue into the new week.
DeleteThanks Roberto. When "hunting the herd," best to pick out the most susceptible, weak targets to take down the kill. At least that approach works for wolves, hyenas, lions, and the like. Good hunting to you.
DeleteBased on relative strength comparisons between various ETFs I see a lot of trends changing in the coming weeks into February. Some may already have pivoted (like FANG today), others may finish the current moves into the end of the month and then reverse. Starting with what I see being the weakest to strongest indices over the intermediate term-
DeleteNYFANG < SMH < XBI < IWM < QQQ < EEM < XLF < SPY < DIA
Look for breaks of the current trends and confirmation of reversal, for example - https://i.imgur.com/7K8kfJ5.png
I think the drop will not begin until the 20th, it is the inauguration usa and whatever happens that day the drop will begin later
ReplyDeleteThe drop will begin with the media starts writing about how many people stopped using the big social media platforms. That should be any day now.
DeleteI would say 20th is 5w lower high.
DeleteAvi Gilbert expecting sp500 to 4600 this year!
ReplyDeleteAvi Gilburt can not make a difference between impulse and correction so I do not really care what he thinks - he can not count EW braking the rules all the time.
DeleteHe will fail miserably again like in 2019. I do not know how someone can take him seriously.... traders have short memory.
Definitely talks up his "successes" anyway
Delete"He will fail miserably again like in 2019. I do not know how someone can take him seriously.... traders have short memory."
DeleteIn fairness you failed miserably as well in 2019. All one has to do is look at your 2019 charts. Lots of people have short term memory.
In fairness in 2019 getting out three months earlier for example at 3200 was way better than buying fantasy third wave 4000 and watching everything evaporate for 4-5 weeks.
DeleteAdmit it to your self and you will feel better.
3 waves down from Jan/Feb peak, 3 waves up now from March low. I am expecting 5 waves down to hit lower trendline. 2100 by April.
ReplyDeleteDed, tomorrow the exit doors get taken off
ReplyDeleteYou were never calling 3200 in 2019. Maybe once we got there. You were even trying to short the market. I remember cause I lost money trying to follow. Not trying to start shit just being honest.
ReplyDeleteAnd Nelly?
ReplyDelete4th January is another possibility for 10w low
ReplyDeleteAccording to the indicators I use the answer is no, example - https://stockcharts.com/h-sc/ui?s=%21MCOSIRSPX&p=D&yr=2&mn=0&dy=0&id=p03552267157
DeleteIf you look at weekly chart there is three sideways candles two of them red showing downward pressure - this is the down phase of this 10w cycle.
On weekly line chart you will not even see this push lower on 4th of January.
Neely has updated his charts to be short term bullish into Feb, before B wave terminates!
ReplyDeletehow low does he say we go down next?
DeleteHe doesn't really say specifically
DeleteI find Neely's analysis ambiguous and poorly worded. He continuously changes or alters his predictions.
DeleteNot impressed......
Seems most elliott wave technicians short term wave counts are open to changing,his long-term perspective hasn't altered much, still sees this as a B before a massive final leg correction
DeleteWe have very complex B wave of a triangle or what ever - you CAN NOT predict the path it will take.
DeleteYou can not predict the shape of b/4-waves in advance - it is impossible. This is the nature of this waves.
All you can do is to predict part of what is this corrective wave and you have to adjust all the time. Close to completion its pattern will be visible.
For someone with EW experience it is well known and you have to accept it.
For someone without EW experience this theory is garbage.
Best flags on nq and es and now everyone is convinced were going higher
ReplyDelete"bear"
DeleteLook at the vix, 50 MA to slope dounward
ReplyDeleteAnd in the dayly chart we have bull flag
ReplyDeleteLet's see if a few days. I believe tech ended on Friday
Delete3840-3900 before a decent drop. Those trendlines sure look like they wanna get clipped. Been pretty obvious since Sept. Stop making this difficult.
ReplyDeleteHighs from the euphoric Friday still not taken out yet
DeleteJust if they don't break 3660, break the canal
ReplyDeleteSorry, 3760
ReplyDeleteyou are back again?
Deleteyou were gone for a while but now back..
I don't understand why you angry, I am very appreciate krasi work that because I follw him but I look to other technician, we can see a Very nice up canl and support that brings the buyers
ReplyDeleteKrasi, any update thoughts on this week's action? Thanks!
ReplyDeleteLevitating and doing nothing probably waiting for the option expiration the end of this week.
DeleteIt looks like 5w high, this is the fourth week already and next week lower into 5w low.
Welp looks like Bidens plan is gonna be the catalyst for the move down. Double top on spx.
ReplyDeleteIf we see carefully, With these many people into market, even short sellers don't have money to short the market.
ReplyDeleteIt's just that many stocks in S&P are yet to grow, so correction is simply rotation to growth stocks from speculative stocks. At the end they're in same index.
Look at the analysis below. Simply superb.
https://www.tradingview.com/chart/SPX/PcoCZprf-S-P-500-Has-a-Lot-More-Room-to-Grow-Too-Early-for-a-Recession/