Trading trigger - buy signal, time for the next high.
Analysis - long term sell the rips, we have major top. Intermediate term - close to important high.
P.S. - for a trade both analysis and trigger should point in the same direction.

TECHNICAL PICTURE and ELLIOTT WAVES
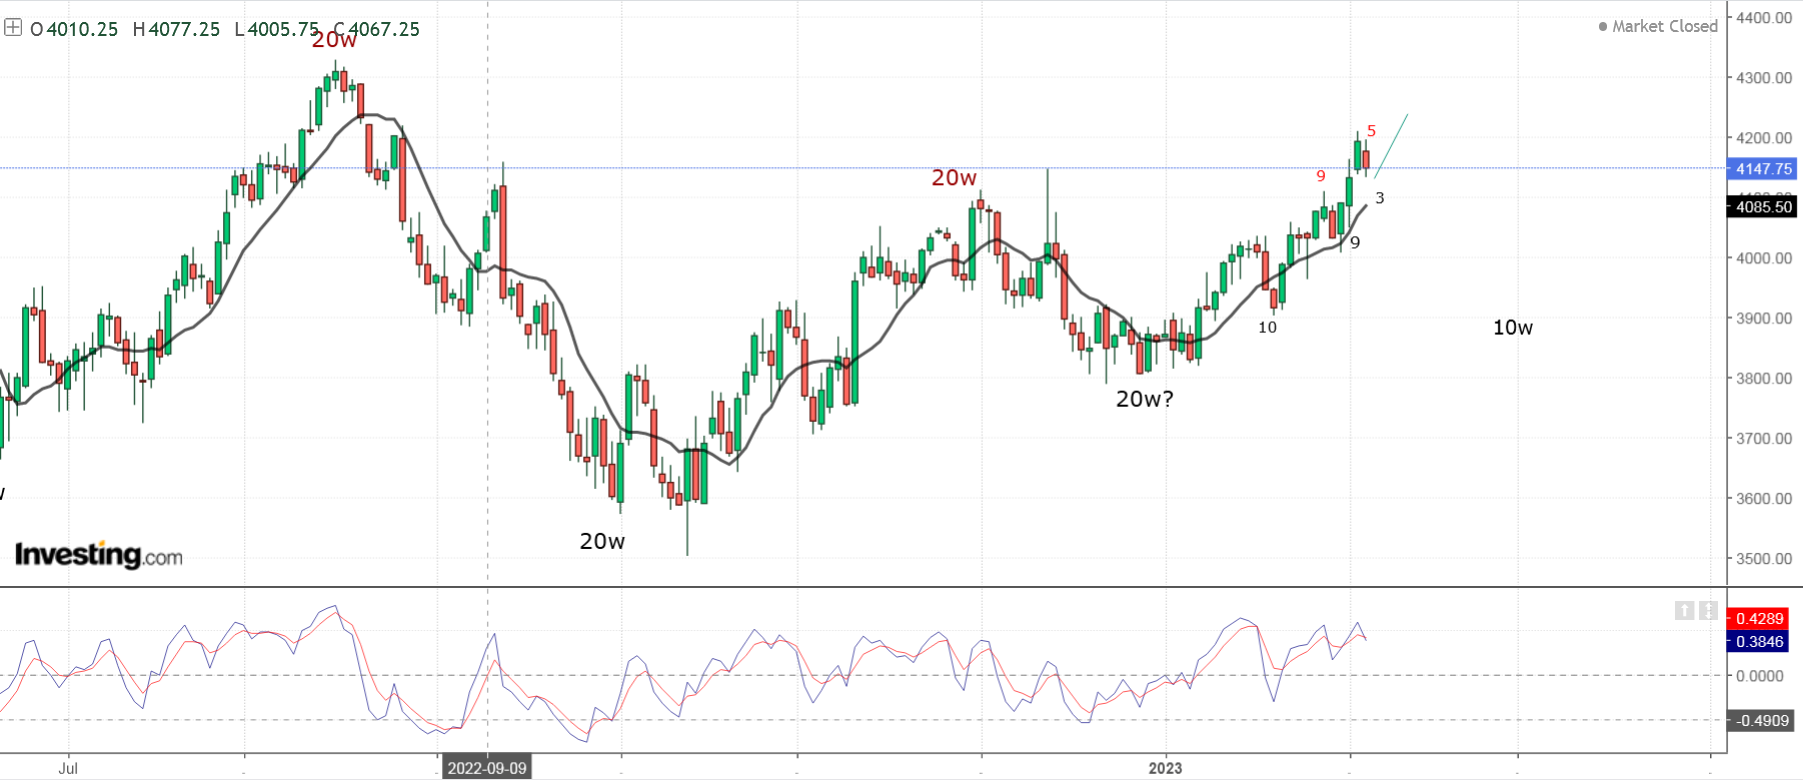
Short term - complex pattern from the last important low. There is many possible combinations I am showing this because it is in sync with DJI showing more simple pattern and second it is the most common pattern from the last several years - double zig-zag.

Intermediate term - the alternate scenario is playing out. I see leg lower 5.5 months and complex sideways correction which started in June.2022 lasting 7.5 months. Next waiting for the top and another zig-zag lower for 6-8 months. How to try to fit cycles seaking 20w low - than you nead b/B wave as running/expanded flat(yellow). This does not make much sense because we have a/B lasting 7 weeks and b/b/B lasting 6 weeks. Short said we have rather two legs of the same degree than some sub-wave.Another option is w4 of diagonal for wave C impulse and the whole pattern is flat from June.... but all this patterns ending diagonal running/expanded flat are rare - if we see it fine, but I would no bet on it before seeing it.

Long term - most likely huge double zig-zag from the 2009 low B-wave was completed and multi year decline has started. If we are lucky it is lower degree b-wave. Interesting MACD reached the zero line and RSI the trend line.

MARKET BREADTH INDICATORS
Market Breadth Indicators - extremes and divergences, the indices are at important top.
McClellan Oscillator - divergence.
McClellan Summation Index - extreme overbought.
Weekly Stochastic of the Summation Index - buy signal.
Bullish Percentage - divergence.
Percent of Stocks above MA50 - divergence.
Fear Indicator VIX - hit the long term trend line starting in 2017.
Advance-Decline Issues - divergence.
HURST CYCLES
Short term cycles - possible 20d cycle low at day 9 or DJI showing again more simple picture.
Week 16 for 40w cycle starting in October.
Usually the cycle lows are at pattern lows so the 18m low should be in June. The first 18m cycle divides very good in two, the second 18m cycle divides very good in three and the third one looks like a mess. A guess in the moment - count one 20w cycle June-October, count 40w cycle October-April and one final 20w cycle. This will fit perfect with the pattern - like this .... or stick to the theory and try to find the 20w/40w low.

On the long term chart a few weeks back, it was showing the final move could hit 2200, the latest one shows it ending at about 3000. Is that where you expect the final drop to come in at now? Thanks
ReplyDeleteNow we have pattern to work with so I have projected second leg lower with the same size.
DeleteThis is the most common extension 1x1, but there is no problem to see 1,618 extension which is 2200.
Lets start humble and see how it will develop...
closing gap in 4280
ReplyDeleteThe yellow one of intermediate term
DeleteAnd 18m high in April
DeleteI see gap around 4210-4220 there is nothing at 4280.
DeleteWell, actually there is if we look at ES March delivery contract
DeleteThis guy suggest that we have triangle in the middle of a corrective leg - http://studyofcycles.blogspot.com/2023/02/hidden-in-plain-sight.html
ReplyDeleteThis is interesting because we have our missing 20w cycle low at pattern low at week 16 exactly where it should be and one more 5w cycle to complete the 20w high which is 10 weeks long at the moment - https://invst.ly/-7f9f
Short said fits the cycles like a glove.
Updated chart with the cycle lows which I wanted to post yesterday, but investing.co was refusing to generate a link obviously with a reason:) - https://invst.ly/-7fds
DeleteIt doesn't really matter where is the 20w low for a bearish trade. The most important is the 18m high
DeleteIt matters if you think it's the 20 week low is the big sell off
DeleteKrasi, where is oil headed in your opinion?
ReplyDeleteLower like everything else.
DeleteAre you adding to your short today? Looks like an ideal day to add...
ReplyDeleteThere is no completed pattern or cycle waiting for now.
DeleteStill think price needs to make one higher high in the short term chart to complete the current pattern?
DeleteEither this or one more 5w cycle high.
DeleteToday should convince bears to give it up. Maybe we get a Valentine's day massacre
ReplyDelete20d low yesterday?
ReplyDeleteLooks like Neely wasn't the only one who was right. Going back to ATH.
ReplyDeletemeant to say the only one who was right was Neely.
DeleteFunny you post this just as the market turns down
DeleteThe herd living in some fantasy world. Completely clueless, learned nothing, greedy and stupid.
DeleteNeely is another failed expert. How right was he with his previous forecast? The same will happen with his current forecast....
Good luck...
spx 5000 for the Christmas rally :)
DeleteNo at least 10000...
DeleteGonna be a bad ending to the week. Top was last Thursday
ReplyDeleteI think we have one more high next week after what looks like a stretched triangle w4 completes soon. Bulls' fantasies are about to evaporate after that final blowoff.
ReplyDeleteJP
here comes the blowoff to get the bulls a bit more arrogant and delusional;))
ReplyDeleteEven bears don't think the top is in. Interesting
ReplyDelete:)) maybe you are right! i am looking to add to my shorts but i may not get the opportunity to get it from higher lalaland levels:)
DeleteJP
Everything is possible, but there is no reversal signs and my view of cycles is one more 5w cycle to complete the 18m high... so waiting and watching.
Deletethe dow six-day consolidation looks like a flat with wC underway, which may point to a higher high once it ends maybe tomorrow.
DeleteJP
Krasi, what do you mean by reversal signs? What can be an indication before the price actually falls?
DeleteMoving faster in the opposite direction - for example the last move up lasted 10 days now we have 5 days lower retracing so far only 38%.
DeleteCycle topping earlier left translated less than half of the cycle time - the last 20d cycle high is 2 days lower and 9 days up.
Indicators with divergences - some market breadth indicators have
Thank you, the up and down candle analysis is quiet interesting
Delete3980 is a nice target for 20w low, pullback to the trend line from January 2022 and trend line October December 2022
ReplyDelete