Trading trigger - sell signal.
Analysis - long term sell the rips, we have major top. Intermediate term - pause for a week and lower for two months.
P.S. - for a trade both analysis and trigger should point in the same direction.

TECHNICAL PICTURE and ELLIOTT WAVES
Short term - two legs lower with the same size and zig-zag higher... is there more to the upside for 10w high?... maybe FOMC is a high or continuation lower next week and final flush lower... it is not possible to say at the moment. For now sticking to the initial plan shown on the chart.

Intermediate term - in the middle of wave b/B.
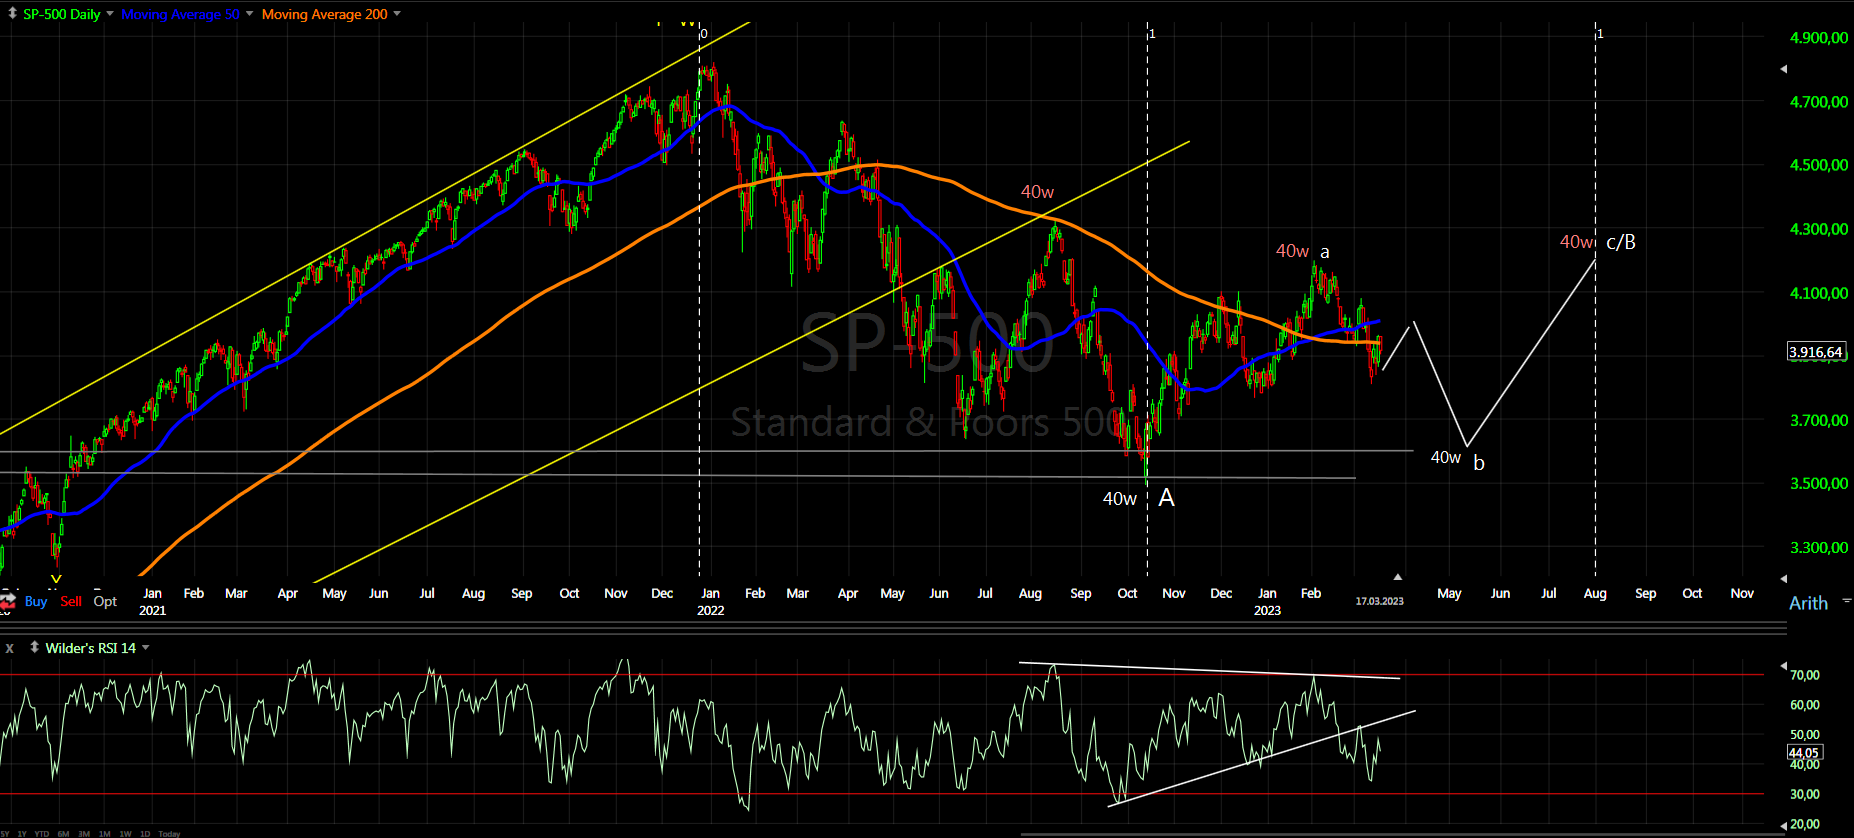
Intermediate term - b/B completing with long 20w cycle followed by long cycle for the 20w high.

MARKET BREADTH INDICATORS
Market Breadth Indicators - at oversold levels, trying to turn higher, but no reversal signs so far.
McClellan Oscillator - bounce higher from very oversold level.
McClellan Summation Index - sell signal.
Weekly Stochastic of the Summation Index - sell signal.
Bullish Percentage - at the oversold level.
Percent of Stocks above MA50 - below 25.
Fear Indicator VIX - hit 30 and retracing.
Advance-Decline Issues - oversold level.
HURST CYCLES
Short term cycles - close to 20d high, next is decline into 20d low.
Intermediate term possible 10w low and now higher into 10w high.

Possible 20w cycle low or final flush lower next week. Watching the price action next week for further clues. I think we have 40w cycle consisting of three cycles - it looks more and more likely.
Here is how I see the DAX

Good stuff Krasi thank you, glad to see I'm not the only one seeing the daily rsi as being too low for a substantial move down from here.
ReplyDeleteThe fed is pimping again, we are going to see pivot
ReplyDeleteFor n-th time I will not waste my time explaining - you are from the sheep so it is useless.
DeleteI told you many times this game is not for you, think about to quit trading.
Pumping
ReplyDeletePimping is more accurate
DeleteThanks for the Dax view Krasi.
ReplyDeleteI have showed it because it is the same like the US indices. It confirms the analysis...
DeleteThere will be a brief pause in the decline as the Fed's move is assesed. When everyone sees that any significant upside is gone, it will fall hard immediately
ReplyDeleteI hope so this is what my analysis is showing.
Deletelooking right now like FOMC will be completion of B wave.
ReplyDeleteKrasi, look this chart, it is wild :) bearish divergence as never before...
ReplyDeletehttps://stockcharts.com/h-sc/ui?s=%24NAAD&p=D&yr=0&mn=6&dy=0&id=p02177917295
Krasi, you don't like my react but, look at apple, NDX, you can't ignore, they are looking storog, in the dayly chart, if NDX go up 13300 it Will be in the weekly chart
ReplyDeleteThe decline is not over until we see 4y cycle low, the FED will not stop until they see the stocks lower.
DeleteWhen you can not accept it, it is your problem. The market does not care about your feelings and wishful thinking.
You are looking for confirmation trying to convince me in some fantasy - it will not gone a happen.
Amateur behavior based on emotions.... over and over for years - this game is not for you.
the c wave of the overall B wave bounce may be shaping up as an ending diagonal for spx with one small down wave (c of d) and final e wave up to come before we put a top. if this is the case we could be marking the top bounce a couple of days after fomc. we'll see.
ReplyDeleteJP
All equity indexes nicely setting up for a monthly retest of their Sept./Oct. '22 lows, for a bullish divergence versus indicators/oscillators. THEN a buy ... at least on intermediate timeframe.
ReplyDeleteAny clue as to what today was
ReplyDelete20day high, the second chart in the middle of this yellow b-wave
DeleteKrasi, what do you think the dump yesterday after FOMC, is it a completion of b-wave?
Deletekrasi, is there any chance that yesterday was the entire wave B completion and we started the crash leg C wave into april? thank you
ReplyDeleteJP
yes, Krasi, what is your thought now ?
DeleteIf you see a triangle from the low in June.2022... and still one more down up will look better to complete zig-zag for e/B.
DeleteAll this is based only on pattern and SPX.... if you crosscheck with other indices and tools the odds are low.
thank you
DeleteJP
i strongly believe next week is either an explosive rally or an outright crash. nothing in between. the question is which of the two scenarios will it be!
DeleteJP
i favor a 300-400 sp points decline for whatever it's worth...
DeleteJP
I expect nothing to happen. Today is day 7 so right translated 20 cycle which means pullback and higher to complete the 10w high.
DeleteWhen do you expect 10w high? Based on the chart, looks like latest by early April?
DeleteYes, early April.
DeleteC of B now it looks like
ReplyDeleteKrasi, are you already short? Not sure if you quit your previous short or just stayed in
ReplyDeleteJust holding the previous one from the December highs.... it just oscillates up and down around this levels.
DeleteToo busy to follow on daily basis to take profits and reenter.