Trading trigger - buy signal.
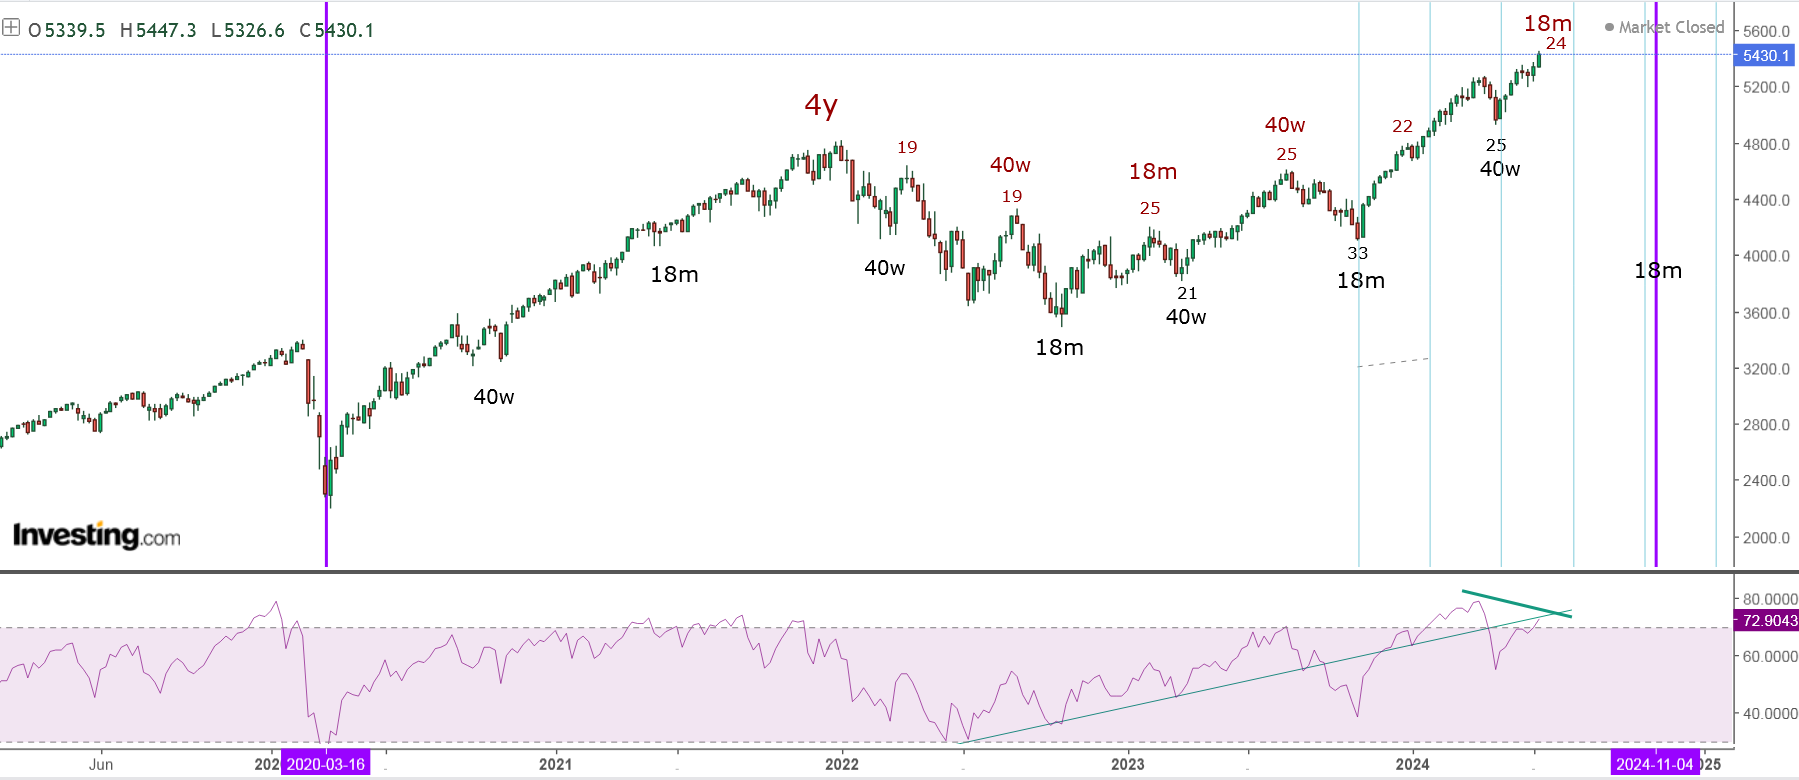
Analysis - important top 18m high, which could be the price high for the 4y cycle.
P.S. - for a trade both analysis and trigger should point in the same direction.

TECHNICAL PICTURE and ELLIOTT WAVES
Short term - the impulse pattern is completed, now we should see reversal. I am suspicious about this impulses... if we see more to the upside it is another double zig-zag and not an impulse.

Intermediate term - double zig-zag and topping similar to 2021 with RSI/MACD divergences on all time frames daily/weekly/monthly. NDX double zig-zag nice Fibo levels and alternation a/c wave size between the two zig-zags.

Long term - double zig-zag(from 2020) for y/B at 9y cycle high 2000-2007-2015-2024.

MARKET BREADTH INDICATORS
Market Breadth Indicators - no, change, weak with divergences.
McClellan Oscillator - below zero.
McClellan Summation Index - sell signal with double divergence.
Weekly Stochastic of the Summation Index - sell signal with double divergence.
Bullish Percentage - in the middle of the range.
Percent of Stocks above MA50 - in the middle of the range.
Advance-Decline Issues - in the middle of the range.
Fear Indicator VIX - sligthly higher low.
HURST CYCLES
Short term cycles - way too long for one 10w high and if you look at DJ/NYSE I would say we have 10w high in mid-May.
If the pattern with shorter 20d cycle continue this should be a 20d high a lower next week into 20d low.

At 18m high, the cycles 10w/20w/40w deviate from the usual length... if the indices continue with this rhytm we should see 18m low short before the US elections.
Double bearish divergence in NYAD cumulative like in 2021.
ReplyDeletehttps://stockcharts.com/h-sc/ui?s=%24NYAD&p=D&yr=3&mn=0&dy=0&id=p12983289641
Thank you Krasi
ReplyDeletelooks like 5480-5505 spx may be tested next couple of days before some sort of a high is in. not sure this would be the top as or one more will follow in july. the energizer bunny is still going:)
ReplyDeleteJP
krasi whats your upside target spx with this breakout? thanks
DeleteJP
See the second chart the target was touched today
Deletethanks. based on today action so far it looks it wants to move higher maybe north of 5500spx.
DeleteJP
Very interesting. So you think it’s going to drop this week?
Deletemaybe this test of 5500spx and immediate rejection was a bit too predictable. could go a little higher maybe.. will see
DeleteJP
This is the target zone for completed double zig-zag, the reversal is not a surprise.
Deletei am with you krasi but with quadruple opex scam they may play a little game here.. looking to add short position if we get one more high.
DeleteJP
last couple of days look like a w4 formation. unless we break down hard from here (very possible) we will see new ath pretty soon.
DeleteJP
covered all shorts. looking pretty freaking bullish for now. may even have a triangle formation for the past 7 tds. unless we break down on monday this thing is about to fly.
DeleteJP
Looks like only consolidation so far
DeleteKrasi, why do you think NVDA is bubble, look at their cash, it's incredible
ReplyDelete