Aug 31, 2024

Weekly preview

Corrective sideways move for two weeks so nothing new to add - expecting 5w low followed by 10w high short after that. Alternate we have impulse from the last important low and next week the fifth wave will be completed with 10w high.


TRADING
Trading trigger - buy signal.
Analysis - long term important high 18m/4y high. Intermediate term 40w low and now higher into 40w high.
P.S. - for a trade both analysis and trigger should point in the same direction.


TECHNICAL PICTURE and ELLIOTT WAVES
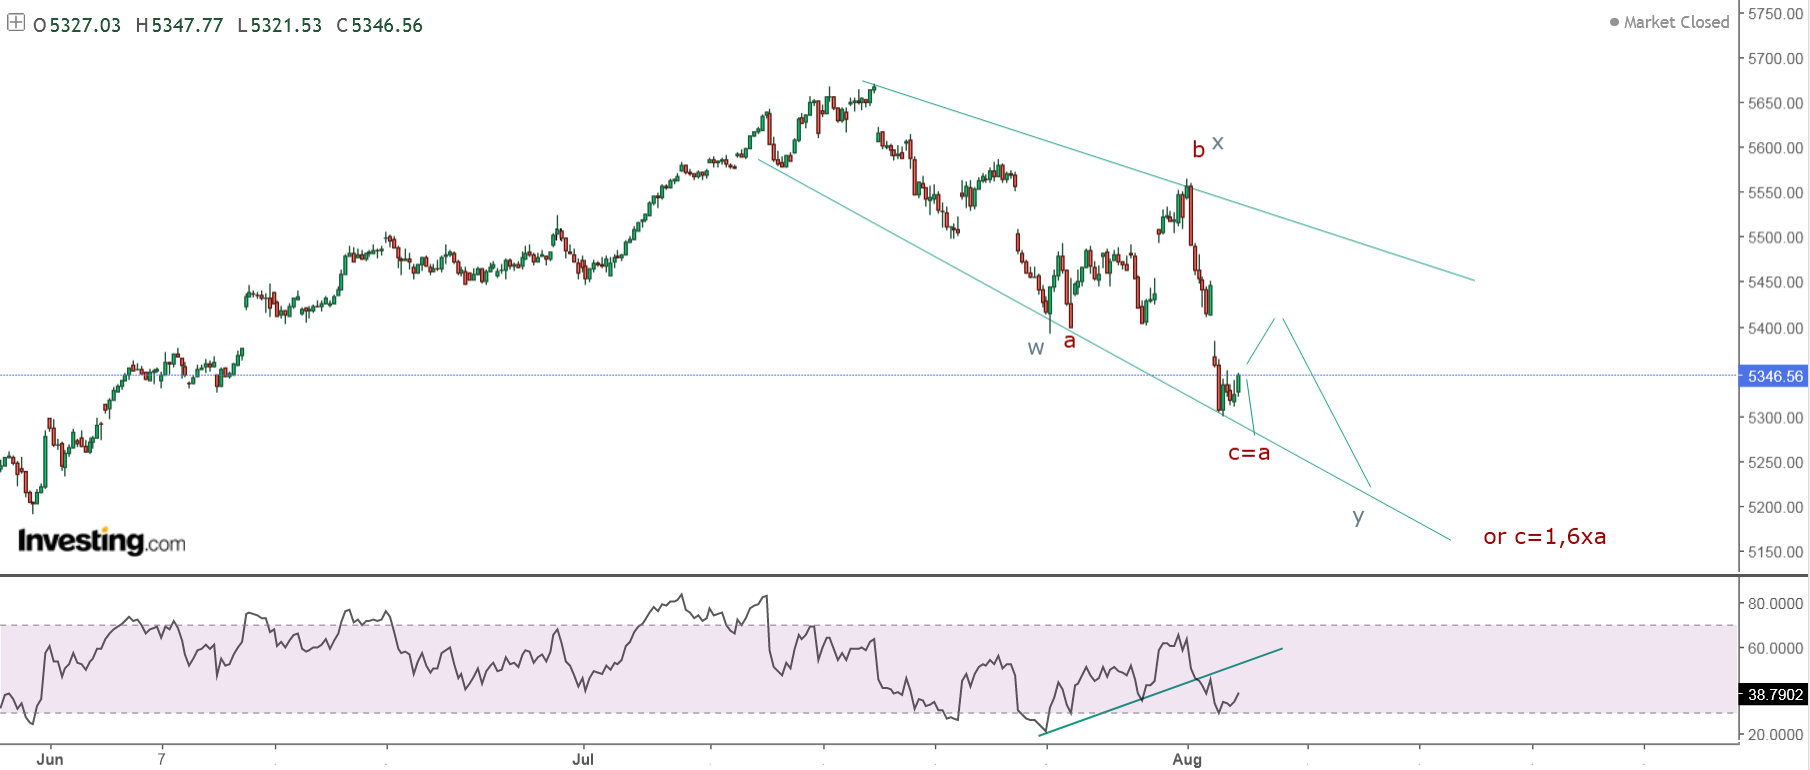
Short term - some X-wave after the a-b-c higher alternate wave 5 running.


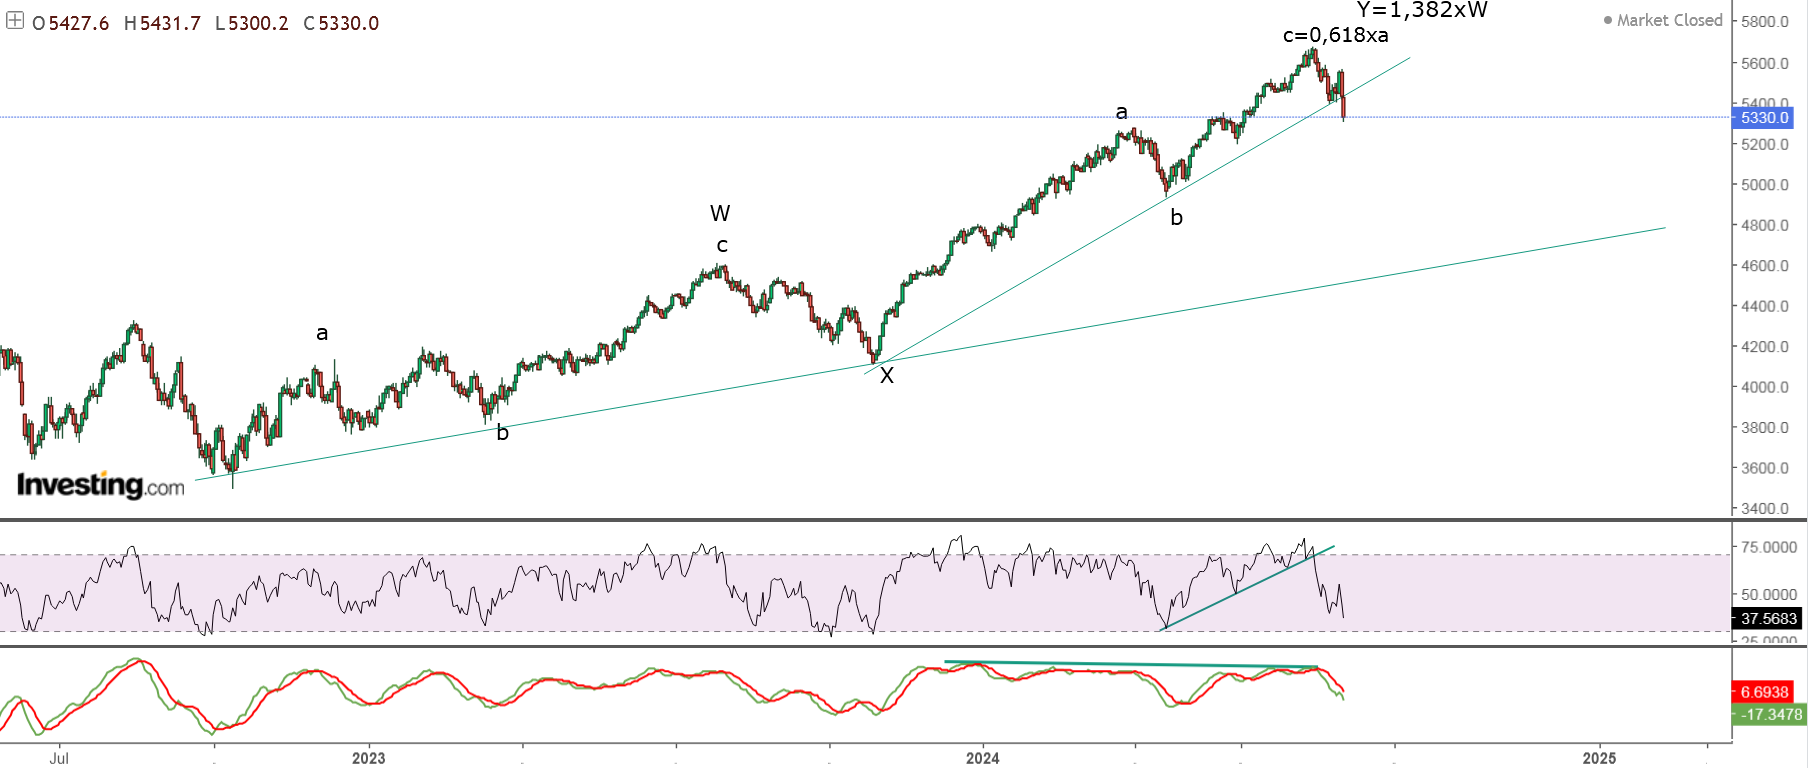
Intermediate term - it looks like complex pattern for the Y-wave... still the same testing the broken trend line.


Long term - double zig-zag(from 2020) for y/B at 9y cycle high 2000-2007-2015-2024.


MARKET BREADTH INDICATORS
Market Breadth Indicators - pointing higher and multiple divergences.
McClellan Oscillator - retracing lower.
McClellan Summation Index - buy signal with divergence.
Weekly Stochastic of the Summation Index - buy signal.
Bullish Percentage - pointing higher and multiple divergences.
Percent of Stocks above MA50 - pointing higher and multiple divergences.
Advance-Decline Issues - turned lower.
Fear Indicator VIX - retracing lower and positive divergence.


HURST CYCLES
Short term cycles - I would say next is 5w low then 10w high. Alternate we have the 5w low and now the 10w high.


Shorter 4y cycle high?

Aug 17, 2024

Weekly preview

No impulse which is not a surprise instead another zig-zag higher.
From cycle perspective this should be the expected 40w low and now 10w high in 2-3 weeks.
From pattern perspective zig-zag lower and zig-zag higher part of a bigger pattern which is not really clear at the moment.


TRADING
Trading trigger - buy signal.
Analysis - long term down into 18m low. Intermediate term possible 40w low.
P.S. - for a trade both analysis and trigger should point in the same direction.


TECHNICAL PICTURE and ELLIOTT WAVES
Short term - zig-zag lower now another a-b-c zig-zag higher... they are part of a bigger pattern not clear at the moment.


Intermediate term - the broken trend line is being tested as expected. Interesting is both legs are 0.786 of the previous one. If this is not b/x wave than we have complex pattern for y/Y.


Long term - double zig-zag(from 2020) for y/B at 9y cycle high 2000-2007-2015-2024.


MARKET BREADTH INDICATORS
Market Breadth Indicators - turned higher, there is no oversold levels so this is not sustainable low and new bull run.
McClellan Oscillator - above zero.
McClellan Summation Index - turned higher.
Weekly Stochastic of the Summation Index - sell signal.
Bullish Percentage - in turned higher.
Percent of Stocks above MA50 - turned higher.
Advance-Decline Issues - turned higher.
Fear Indicator VIX - retracing lower after the spike higher.


HURST CYCLES
Short term cycles - it seems we have the 10w low and now higher into 10w high.


The cycles 10w/20w/40w/18m deviate from the usual length... if you stick to the theory the 18m high should be in March, visualy it should be in the next 2-3 months.
Probably we have the expected 40w low and next is the 40w high.

Aug 10, 2024

Weekly preview

Higher as expected... this should be 5w high, the move looks corrective so when completed early next week continuation lower should follow.


TRADING
Trading trigger - sell signal, testing MA10.
Analysis - long term down into 18m low. Intermediate term lower into 40w low. Short term higher into 5w high.
P.S. - for a trade both analysis and trigger should point in the same direction.


TECHNICAL PICTURE and ELLIOTT WAVES
Short term - this could be wave 4 but it is getting too long so maybe X wave.


Intermediate term - test of MA50 and the trend line? Test now will mean X-wave(the chart above).


Long term - double zig-zag(from 2020) for y/B at 9y cycle high 2000-2007-2015-2024.


MARKET BREADTH INDICATORS
Market Breadth Indicators - pointing lower, no signs of oversold conditions.
McClellan Oscillator - slightly oversold and retraced to the zero line.
McClellan Summation Index - sell signal.
Weekly Stochastic of the Summation Index - sell signal.
Bullish Percentage - in the middle of the range.
Percent of Stocks above MA50 - in the middle of the range.
Advance-Decline Issues - in the middle of the range.
Fear Indicator VIX - back to normal values after the spike higher.


HURST CYCLES
Short term cycles - we should see 20d/5w high early next week, then lower into 5w/10w low.


The cycles 10w/20w/40w/18m deviate from the usual length... caused by the AI bubble. It is better to look at other indices - I think we have 18m high late March and we have topping process several months now heading lower into 40w low and later continuation into 18m low.
Maybe another 18m cycle which does not follow the rules.

Aug 5, 2024

Weekly preview

The week played out as expected - bounce from MA50 and 20d high then another lower low which should be 5w low. Next we should see bounce from MA100 and 5w high followed by lower low 40w cycle low.
The trend is changing and the retail "investors" aka sheeple still do not want to accept it buying the pullback while sharks like Buffett are selling.


TRADING
Trading trigger - sell signal.
Analysis - long term down into 18m low. Intermediate term lower into 40w low. Short term higher into 5w high.
P.S. - for a trade both analysis and trigger should point in the same direction.


TECHNICAL PICTURE and ELLIOTT WAVES
Short term - most likely zig-zag a-b-c, alternate double zig-zag w-x-y.


Intermediate term - bounce from MA50 and the trend line followed by break lower. The leg higher from October.2023 is over.


Long term - VIX the trend has reversed double zig-zag from 2020 completed with double zig-zag wave Y from October.2022 with double divergence and broken trend line.


MARKET BREADTH INDICATORS
Market Breadth Indicators - turning lower and multiple divergencies.
McClellan Oscillator - below zero.
McClellan Summation Index - buy signal, multiple divergencies.
Weekly Stochastic of the Summation Index - buy signal.
Bullish Percentage - turned lower, multiple divergencies.
Percent of Stocks above MA50 - turned lower, multiple divergencies.
Advance-Decline Issues - pointing lower.
Fear Indicator VIX - spike higher and very important tren line has been broken.


HURST CYCLES
Short term cycles - we should see 5w low then 5w high.


The cycles 10w/20w/40w/18m deviate from the usual length... caused by the AI bubble. It is better to look at other indices - I think we have 18m high late March and we have topping process several months now heading lower into 40w low and later continuation into 18m low.