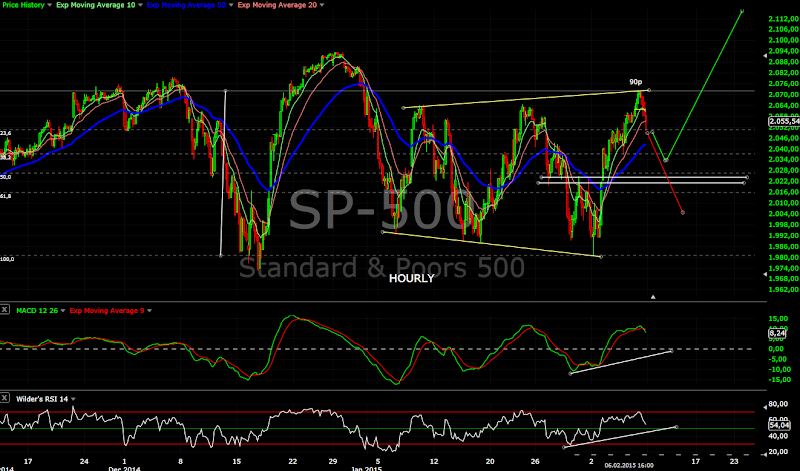
Short term view - lower prices for a day or two
Intermediate term view - next week we will know if the correction is running or we have another 2-3 weeks higher.
Based on cycles I was expecting short term bottom and move higher... it came a little bit earlier, but overall not a surprise. You should not nave been caught on the wrong side shorting the fake break out lower.
The price moved higher to resistance and it is still in the range. As long as there is no convincing break out we have to keep an eye on both bullish and bearish scenario.
Indicators look positive, market breadth - I would say new swing higher has begun, EW - impulse higher, cycles - 40 day and 20 week cycle low. I would keep it simple and say we should see at least another impulse higher after a pullback. BUT the move should show strength and any pullback should stay above 2020-2025.
Now what if I am wrong:
- the prices move much higher than I expect - we are on the right side, I was wrong and I will adjust the forecast/charts. Not really a problem.
- the impulse was wave C of a corrective move(the whole sideway mess), which has finished on Friday, and the next wave lower has begun - it is possible. I will watch carefully how the pullback look like and the 2020-2025 area - the gap , 50% Fibo retracement and support. If this is the case the move lower should be impulsive and move fast below this level.
TECHNICAL PICTURE
Short term - the bullish scenario(green) and the bearish scenario(red). I am leaning more to the bullish scenario but watching carefully the bearish one. Next week we will have the answer.
Intermediate term - the same on the daily chart. MACD is still around zero and bellow the trend line, so we do not have confirmation for a bullish outcome.
Long term - no change. Momentum turned up - another 2-3 weeks higher?.
MARKET BREADTH INDICATORS
The Market Breadth Indicators - I would say new swing higher has begun, but we do not have confirmation or something convincing at the moment.
McClellan Oscillator - above zero... nothing interesting.
McClellan Summation Index - buy signal.
Weekly Stochastic of the Summation Index - buy signal.
Bullish Percentage - buy signal.
Percent of Stocks above MA50 - nothing interesting near the middle of the range.
Fear Indicator VIX - series of lower highs and higher lows....
Advance-Decline Issues - series of lower highs and higher lows....
HURST CYCLES
At day 5 after 40 day and 20 week cycle low.
Low at week 16... perfect right on time. Following closely the current 20 week cycle... when it tops the indexes should move lower to 18 month cycle low and the low for the year.
Tom Demark SEQUENTIAL AND COUNTDOWN - this technique spots areas of exhaustion.
Nothing interesting but to take a look at strength from another angle - previous cycle lows were followed by finished countdown, setup at 7, and the current one is at 4.
If the indexes want to move higher they should print choppy pullback - on Monday bar 5 of the setup should close above 2050(bar 1). If we see another price flip on Monday at day 4(close below 2050) that would mean weakness and I would not expect this rally to last very long.
Subscribe to:
Post Comments (Atom)


great review as always krasi! any new thoughts on eem and tlt?
ReplyDeleteTLT - this should be a pullback which was expected. I expect another higher high.
DeleteEEM - is tricky, but if it follows the major indexes I expect to see the double zigzag which I mentioned last time. Next week to start lower and then to turn up and test MA200. Of course we should watch the indexes in the next days closely.....
krasi, has uso found a bottom this week?
ReplyDeleteI think this should be wave 4. There is a lot of politics involved pushing the price lower so I do not expect V shaped bottom.
DeleteThe pattern does not look finished, no strong divergences, fundamentals not really supportive - I see only opportunity for short term trading.
carnap:
ReplyDeleteHelli krasi,
Your bullish outlook could turn out to be EDT scenario that I have discussed within Yearly Market Forecast.
http://www11.pic-upload.de/08.02.15/fb1so3q2nmi6.png
But short term I agree with you that we will see more to the downside. And the move next week will tell us what we have to expect as a further price development for the next weeks. Below we a a major support at 1992 and 1973 above there is still the resist level at 2064/65 an a possible false break of the level at the Friday´s session.
http://www11.pic-upload.de/08.02.15/pm6ukhwqxe2d.png
The DSS Bressert will need 5 days minimum to reach the oversold zone. But the essential question is what kind of dynamic will evolve and accompanying the move of the oscillator.
carnap
ReplyDeletesorry for the errors, horrible!
Helli krasi,
Your bullish outlook could turn out to be the EDT scenario that I have discussed within the Yearly Market Forecast.
http://www11.pic-upload.de/08.02.15/fb1so3q2nmi6.png
But short term I agree with you that we will see more to the downside. And the move next week will tell us what we have to expect as a further price development for the next weeks. Below we have a major support at 1992 and 1973 above there is still the resist level at 2064/65 and a possible false break of the level at the Friday session.
http://www11.pic-upload.de/08.02.15/pm6ukhwqxe2d.png
The DSS Bressert will need 5 days minimum to reach the oversold zone. But the essential question is what kind of dynamic will evolve and accompanying the move of the oscillator.