Trading trigger - buy signal.
Analysis - sell the rips, time to get out, potential major top.
P.S. - for a trade both analysis and trigger should point in the same direction.

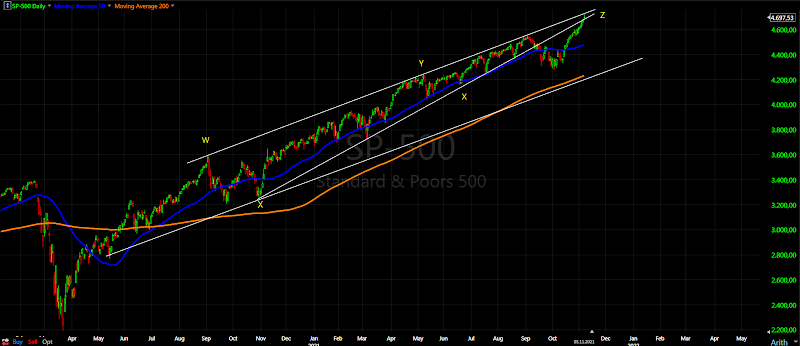
TECHNICAL PICTURE and ELLIOTT WAVES
Short term - it looks like impulse, but looking the DJ you can see another double zig-zag - https://invst.ly/wimw4. Waiting to see the reaction reversal or b-wave. (it is "or a/c/Z")

Intermediate term - I see three zig-zags with roughly the same length in time W-x-Y-x-Z from the March.2020 low. Testing the trend lines and two legs higher with the same size for Z. Waiting to see the reaction.
Long term - topping process running for months and maturing. Some kind of corrective wave b-wave and c-wave will follow. MACD and RSI look very "bullish".

MARKET BREADTH INDICATORS
Market Breadth Indicators - no change signs of weakening, at least short term top.
McClellan Oscillator - lower highs and divergence.
McClellan Summation Index - buy signal.
Weekly Stochastic of the Summation Index - buy signal.
Bullish Percentage - below 70 like double top.
Percent of Stocks above MA50 - below 75.
Fear Indicator VIX - higher low so far... double bottoms short term and intermediate term.
Advance-Decline Issues - lower high and heading lower.
HURST CYCLES
Short term cycles - not easy to spot following the indicator below this is the short term count - 5w high followed by a 5w low and now at 20d high, next we should see a few days correction for a 20d low.

Week 5 for the 20w cycle. Long term I am expecting 4 year cycle high. The 18m low still not clear - either in June on time or late Septembar the case with one extra 20w cycle so that time adjust for the missing one from last year.
Last week wrote if it is not B-wave it is bearish because it is heading higher into the sixth 40w cycle high or 4y high. This is how it looks like - 4 perfect hits one a few weeks earlier and the current one. Perfect hit is in a few weeks. jpnor this is mid-December I can not twist it as a low....

We are testing the underside of the lower trend line of wedge that started Oct. 2020 and broke down Sep. 2021. And we are doing it with a big indecisive, gapped up doji on high volume. If the market is going to start a correction, this is as good a place as any to start. I would certainly not be long here.
ReplyDeleteNo one will believe you:) TA does not work any more:))))
DeleteKrasi, per your last chart, is it the case that sixth 4ow cycle high will come into mid-december and that is when we are likely to have some kind of a significant top? If true, does it mean that it can drag sideways to up for another 4-5 weeks? Trying to make sense. Thanks
ReplyDeleteYes, it can take another month.
DeleteThanks,Krasi.
ReplyDeleteDJ EW count not much different from what I have shown this weekend, but with a small nuance b/Z is a triangle - https://ibb.co/mqN04MQ
ReplyDeleteThis nuance is important from cycle perspective because with triangle all cycle lows/highs short and intermediate term fall into their places and there is no confusion where to place them.
Perfect 4 months for 20w low between the X and b/Z lows, and the 20d/5w highs/lows from the last month are exactly where they should be.
So I think the pattern above is the right one and cycles look like this - https://invst.ly/wjb4q
For a perfect 4y cycle high we should see one more 5w high.... which is not a guarantee.
no major top until January. There still needs to be zigzag of wave that started from Oct low.
ReplyDeletenevermind, on second thought we may be a top. Action so far from 2020 Feb top reminds me of everything that occured after 08 crash into 11' crash except on smaller timeframe!
DeleteIt is very difficult to time tops especially with this extremely difficult pattern.
DeleteIt could be zig-zag but of one degree lower... the best I can do is to look at cycles and they suggest one more 5w cycle. Today I was playing with the DAX and it shows the same - https://invst.ly/wkg84
I don't think it will be that long. Possibly another 1-2 weeks for a top
DeleteABC finishing today? Feels like it.
ReplyDelete