Trading trigger - neutral.
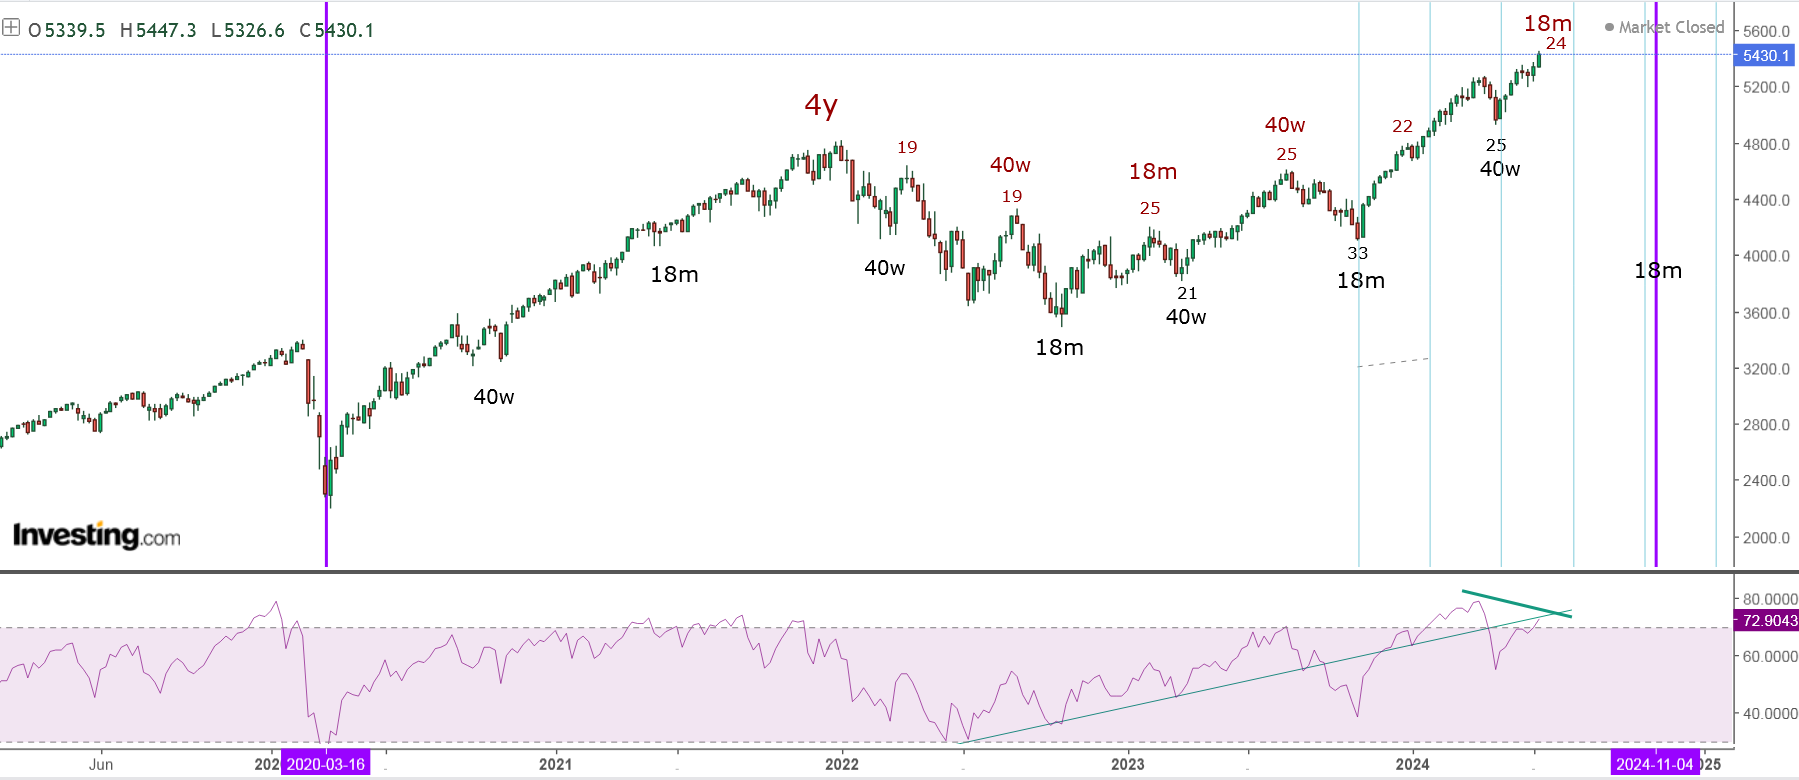
Analysis - important top 18m high, which could be the price high for the 4y cycle.
P.S. - for a trade both analysis and trigger should point in the same direction.

TECHNICAL PICTURE and ELLIOTT WAVES
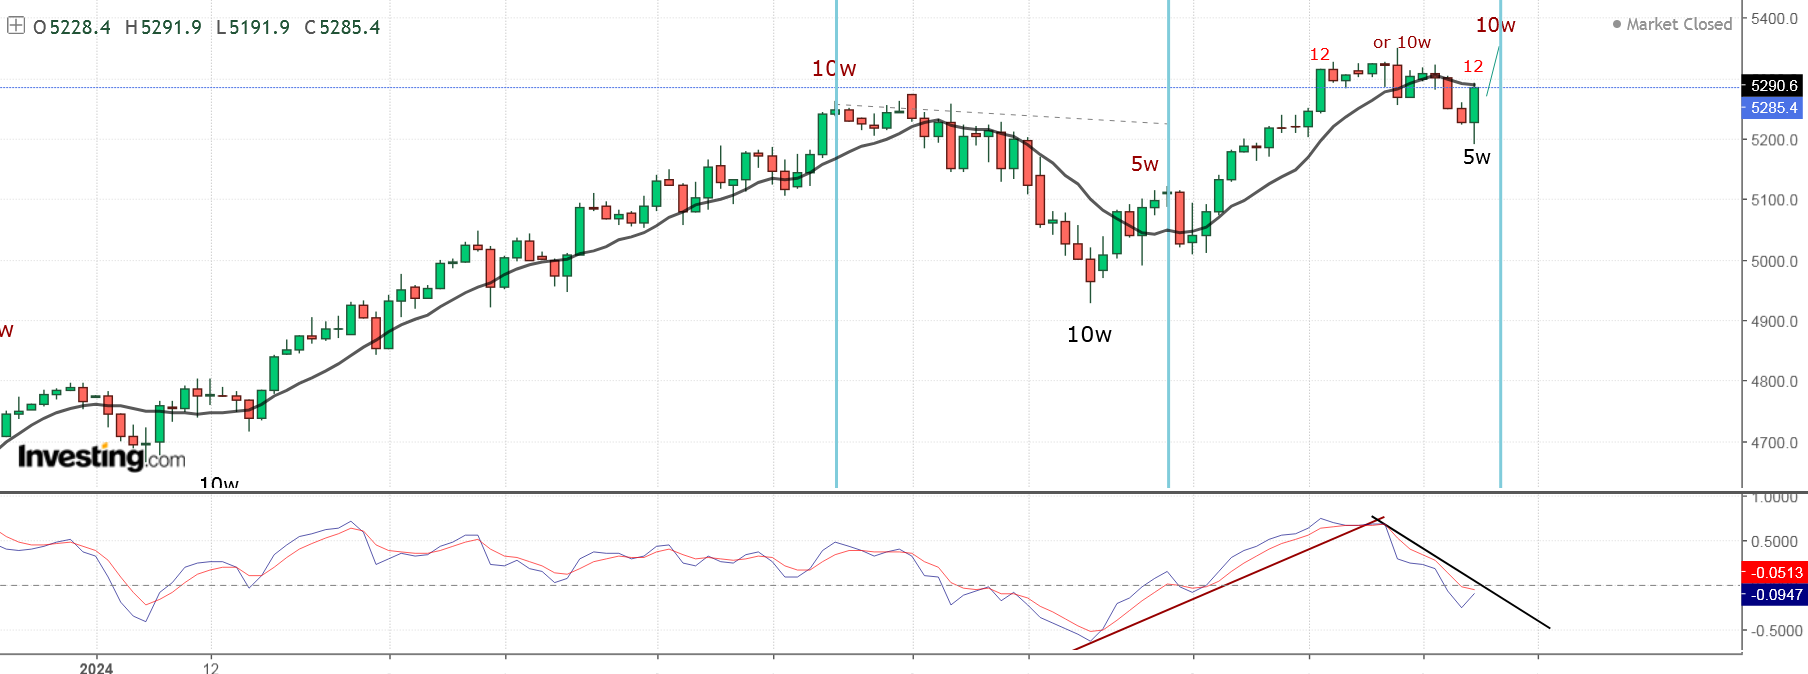
Short term - it looks like mirror image of the prior zig-zag and double top as suggested.

Intermediate term - double zig-zag and topping similar to 2021 with RSI/MACD divergences on all time frames daily/weekly/monthly. Other indices like NYSE/DJ/SPXEW are not following - sideways corrective move in June.

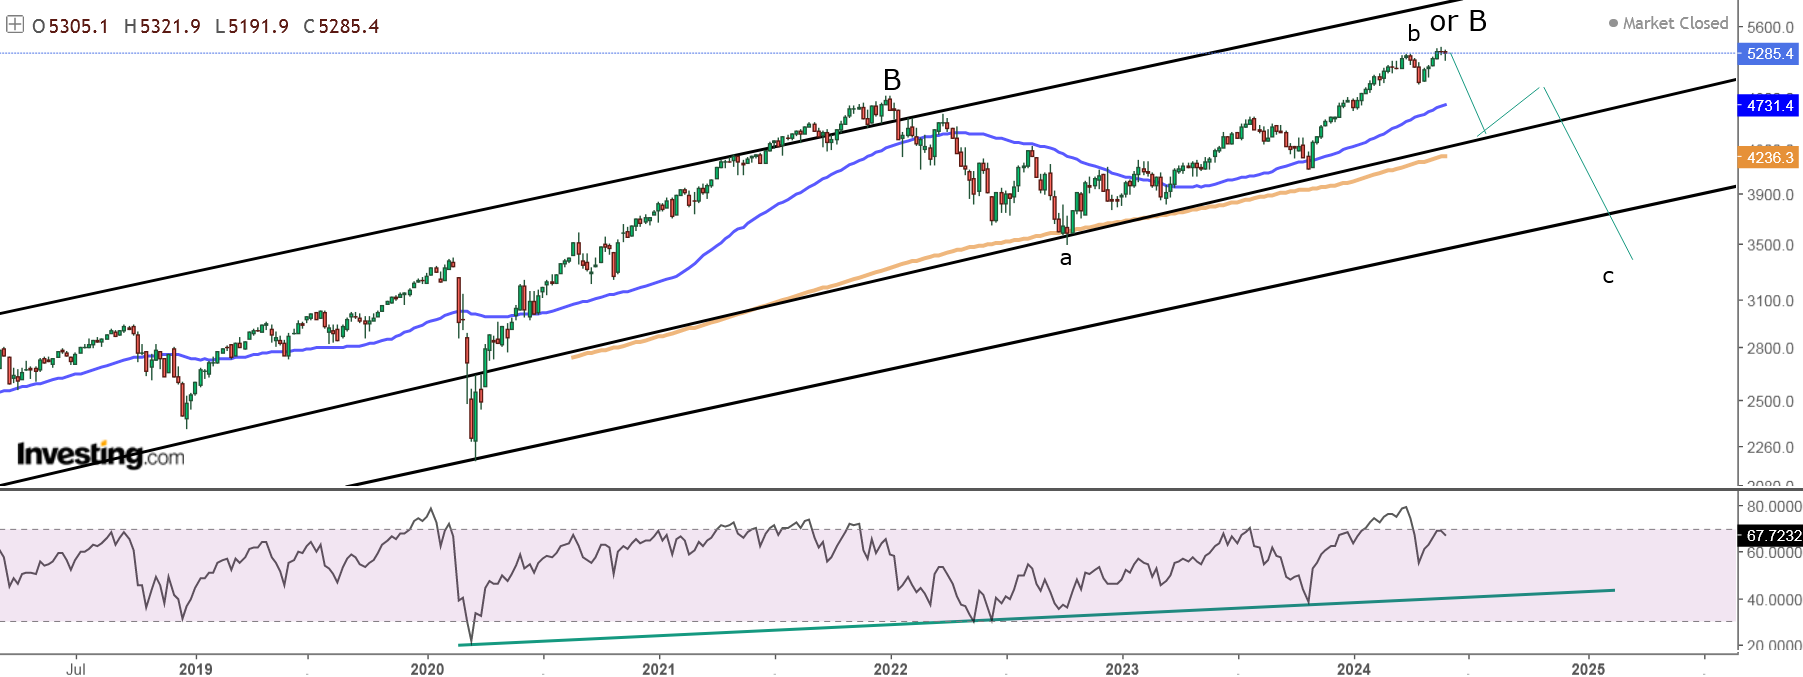
Long term - double zig-zag(from 2020) for y/B at 9y cycle high 2000-2007-2015-2024.

MARKET BREADTH INDICATORS
Market Breadth Indicators - no, change, weak with divergences.
McClellan Oscillator - around zero.
McClellan Summation Index - sell signal.
Weekly Stochastic of the Summation Index - sell signal.
Bullish Percentage - in the middle of the range.
Percent of Stocks above MA50 - in the middle of the range.
Advance-Decline Issues - in the middle of the range.
Fear Indicator VIX - some kind of bottoming.
HURST CYCLES
Short term cycles - if we have a top this is the cycle count which fits. Next is decline into 20d/5w/10w cycle low.

At 18m high, the cycles 10w/20w/40w deviate from the usual length... if the indices continue with this rhytm we should see 18m low short before the US elections.
Pretty consistent cycle highs every 12+-1 weeks... now at week 13 from the previous high. Maybe shorter 20w cycles or 40w cycle dividing in three not two.